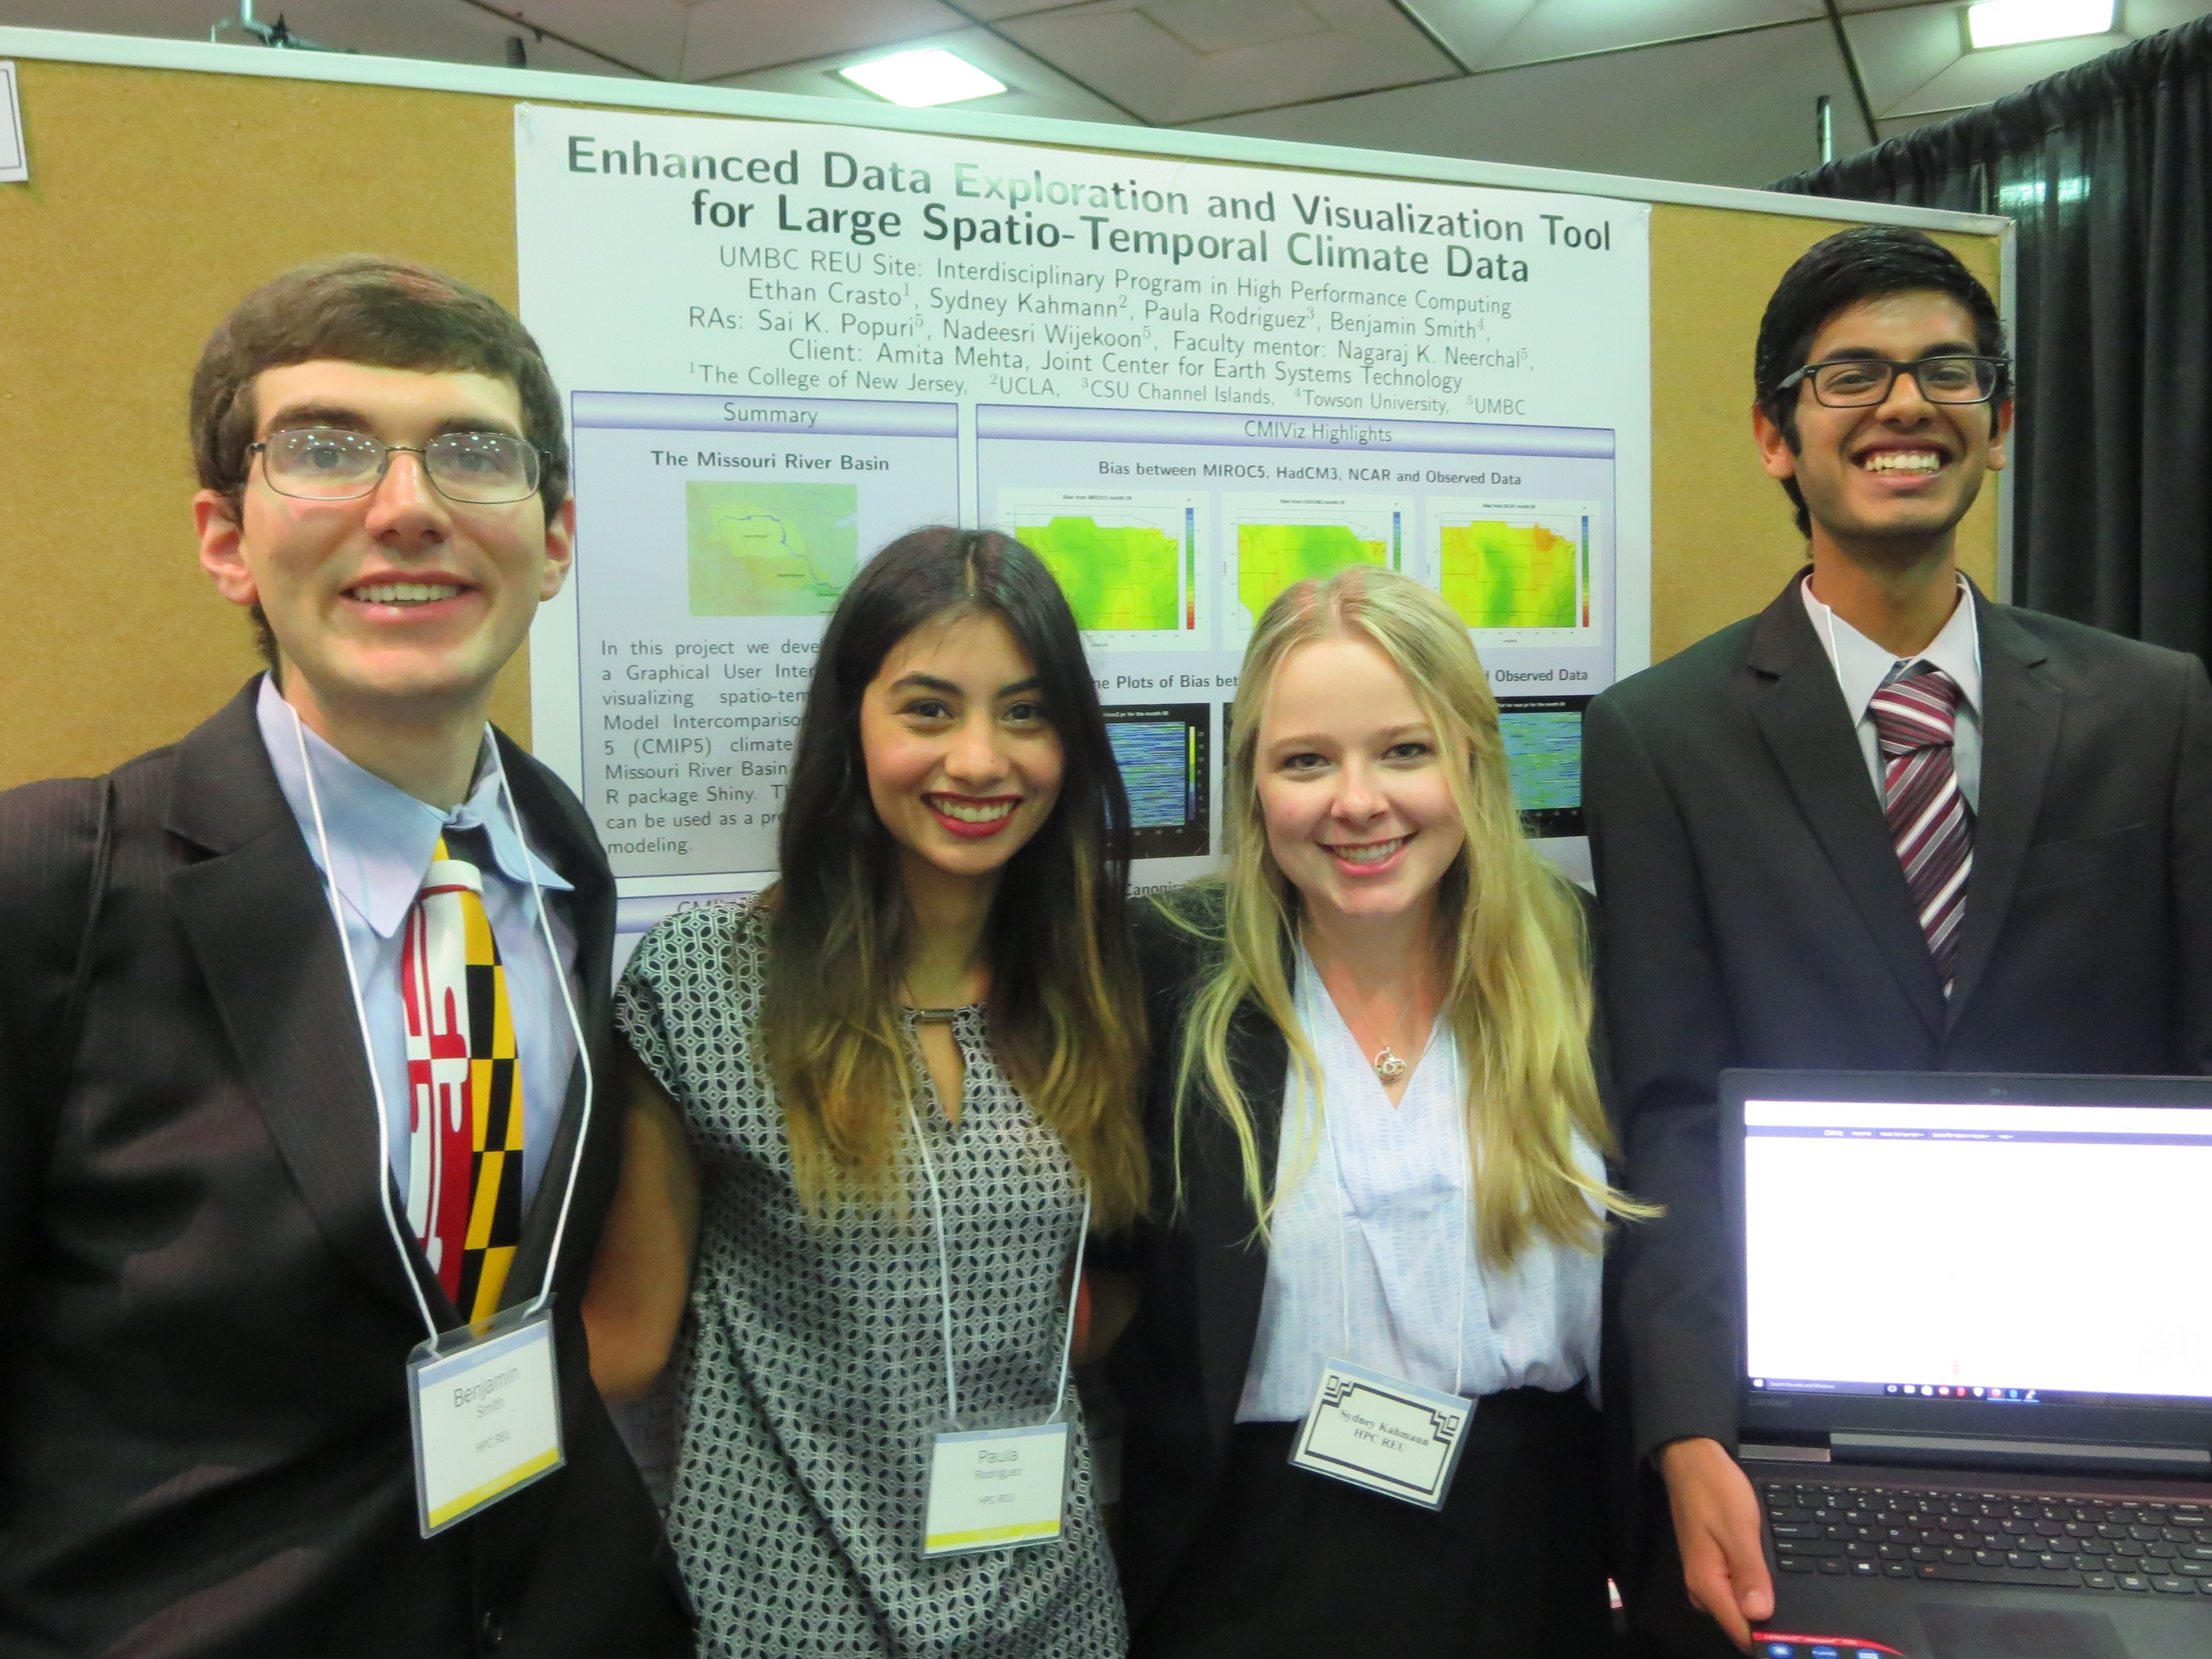
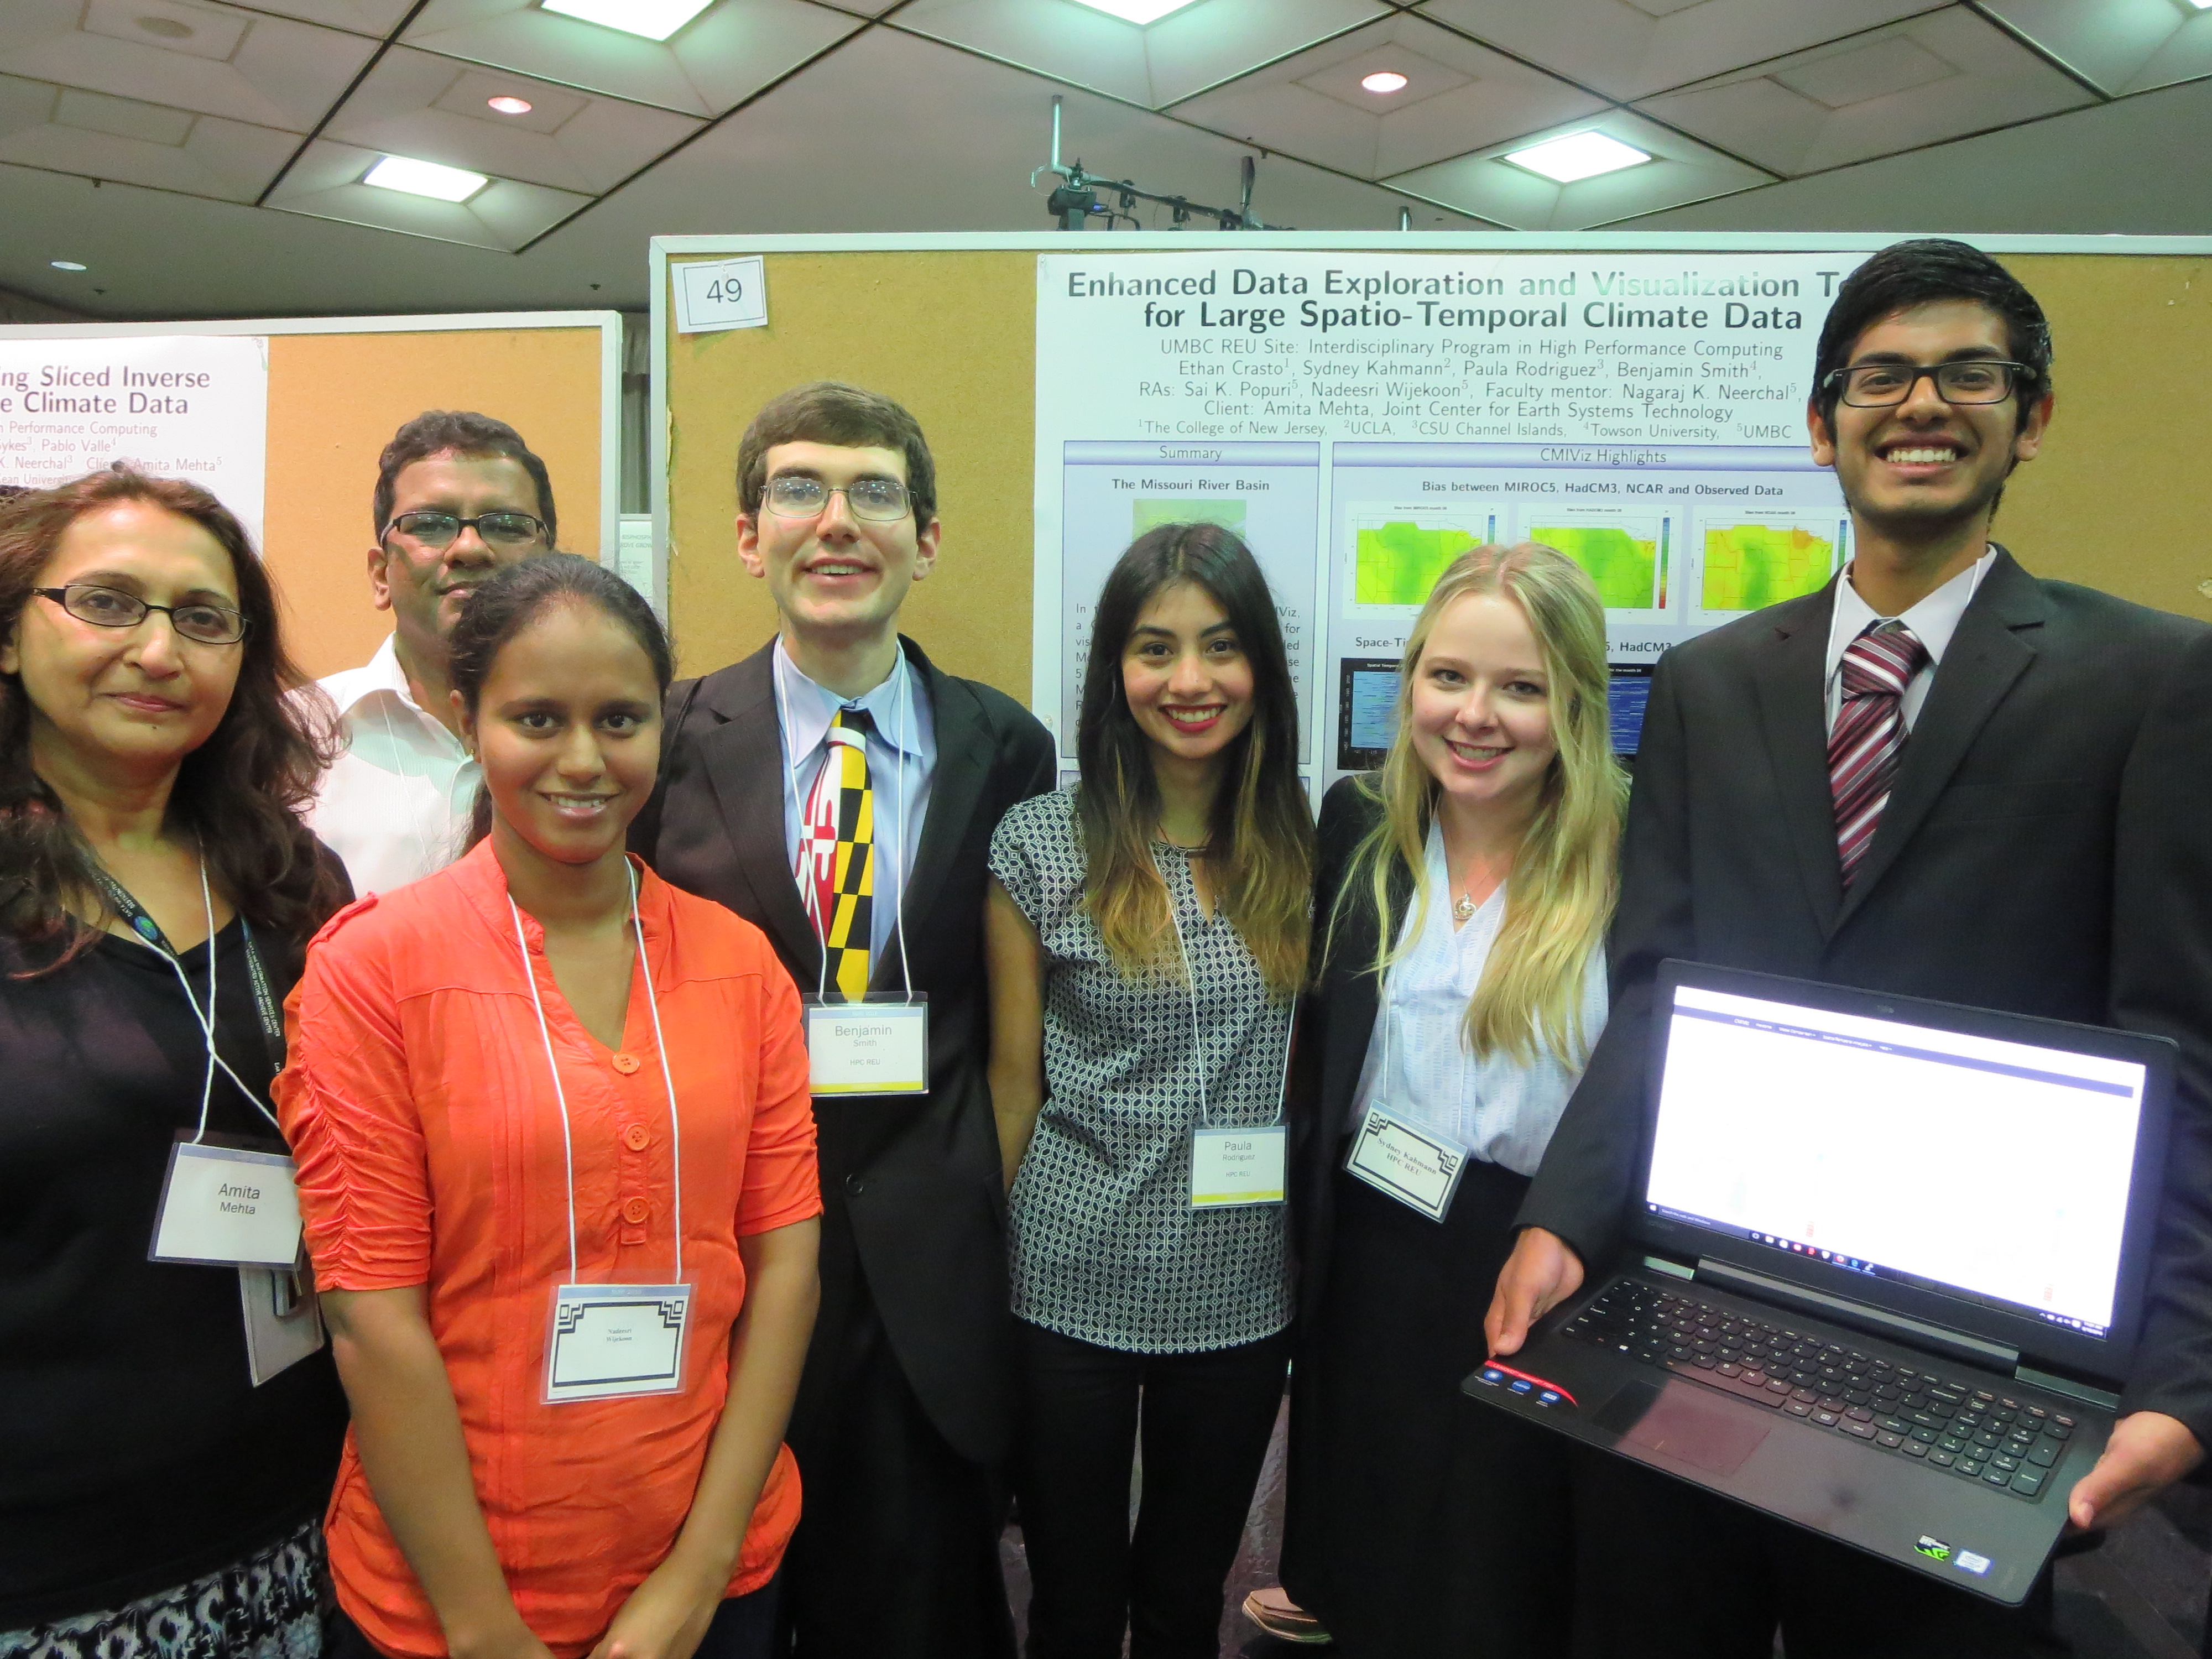
| Team Members: | Ethan Crasto1, Sydney Kahmann2, Paula Rodriguez3, and Benjamin Smith4 |
| Graduate Assistants: | Sai K. Popuri5 and Nadeesri Wijekoon5 |
| Faculty Mentor: | Nagaraj K. Neerchal5 |
| Client: | Amita Mehta6 |
1Department of Mathematics and Statistics, The College of New Jersey,
2Department of Statistics, University of California, Los Angeles,
3Departments of Mathematics and Computer Science, California State University, Channel Islands,
4Department of Mathematics, Towson University
5Department of Mathematics and Statistics, University of Maryland, Baltimore County,
6JCET and GES, University of Maryland, Baltimore County
About the Team
Our team, Ethan Crasto, Sydney Kahmann, Paula Rodriguez, and Benjamin Smith, developed CMIViz — a Graphical User Interface (GUI) for visualizing spatio-temporal Coupled Model Intercomparison Project Phase 5 (CMIP5) climate data from the Missouri River Basin (MRB) — using the R package Shiny. This exploratory tool can be used as a precursor to statistical modeling.
Motivation
The MRB covers approximately one-sixth of the nation and accounts for 28% of farmland in the continental United States. Past research has found precipitation modeling in the region to be particularly difficult due to the semi-continuous distribution of rainfall. Therefore, we created CMIViz, a tool for exploratory data analysis, to visualize climate data and aid in modeling efforts.
CMIViz Features
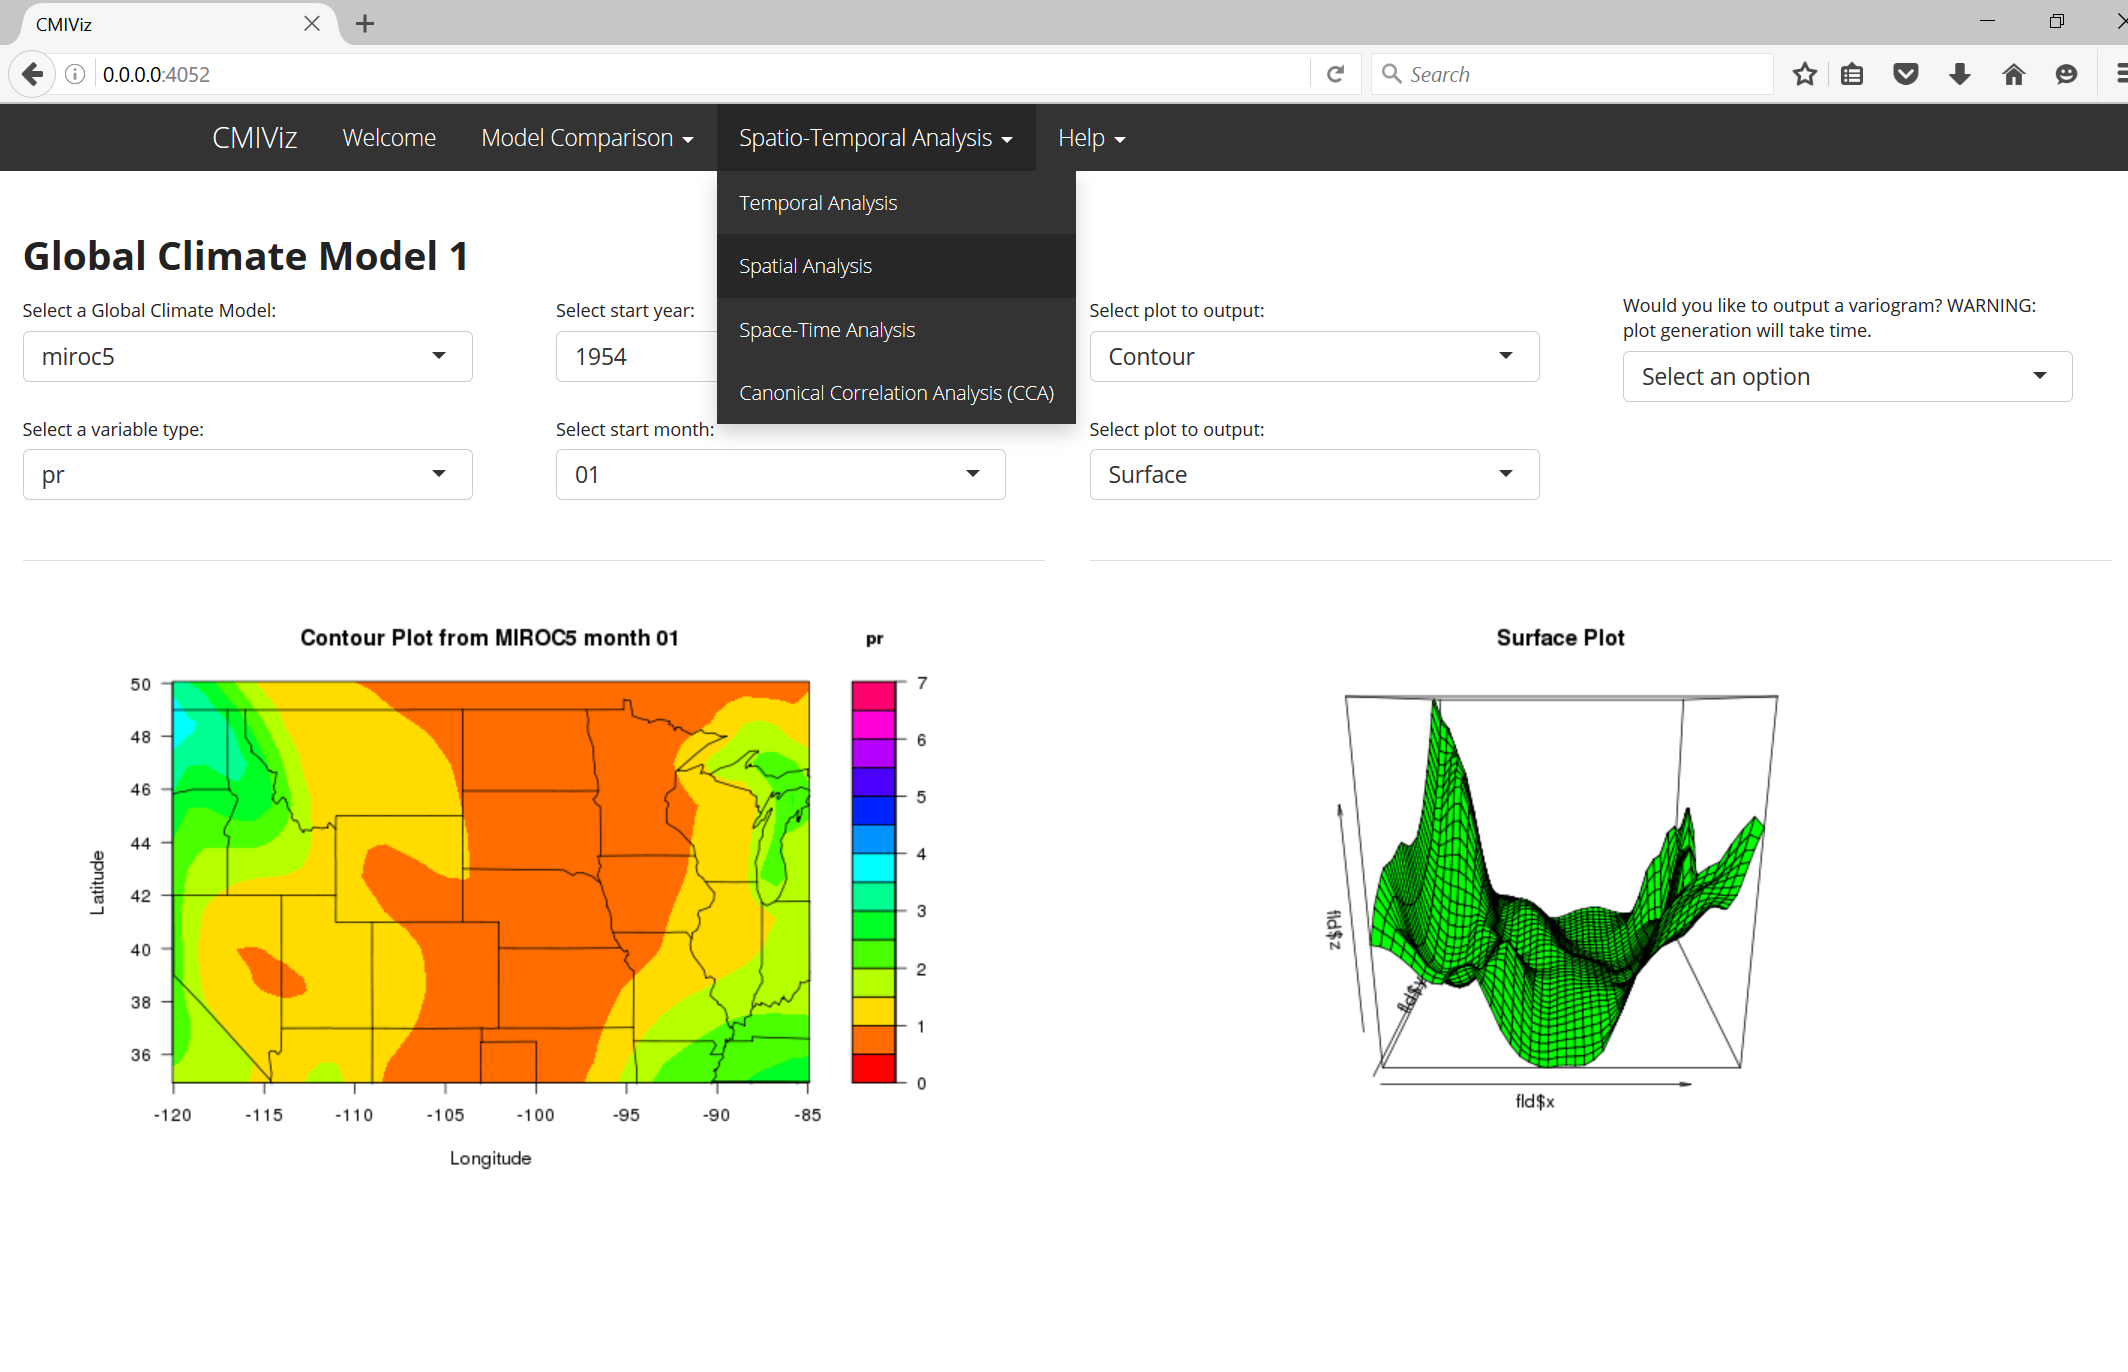
Example screenshot of CMIViz capabilities.
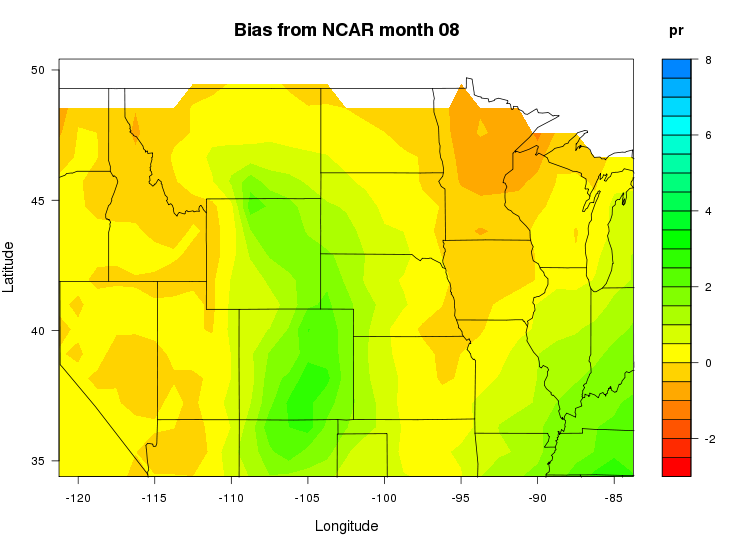

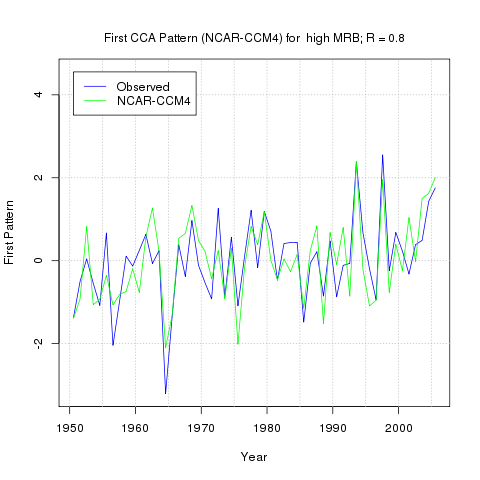
Plots of bias, spatio-temporal bias, and the first canonical correlation pattern for the NCAR-CCSM4 Global Climate Model and observed data for the month of August.
Future Directions
CMIViz is implemented in the R software’s Shiny package and can continue to be developed as new functionality becomes available in R and Shiny. Particularly we would like to see the advanced forecasting techniques (sliced inverse regression and minimum average deviance estimation) our REU colleagues implemented this summer as additional functions in the GUI. Along with adding new features to CMIVIz, some of the existing functionality in CMIViz is computationally intensive and could be benefited from parallelization. Finally, we are interested in hosting CMIViz online so more users have access. As it stands, CMIViz users must be registered with UMBC’s High Performance Computing Facility in order to access the GUI on UMBC’s cluster maya. This process is not possible for those unaffiliated with UMBC, so hosting CMIViz through a different platform would broaden our possible audience.
Links
Ethan Crasto, Sydney Kahmann, Paula Rodriguez, Benjamin Smith, Sai K. Popuri, Nadeesri Wijkekoon, Nagaraj K. Neerchal, and Amita Mehta. Enhanced Data Exploration and Visualization Tool for Large Spatio-Temporal Climate Data. Technical Report HPCF-2016-12, UMBC High Performance Computing Facility, University of Maryland, Baltimore County, 2016. (HPCF machines used: maya.). Reprint in HPCF publications list
Poster presented at the Summer Undergraduate Research Fest (SURF)
Click here to view Team 1’s project
Click here to view Team 3’s project
Click here to view Team 4’s project
Click here to view Team 5’s project
Click here to view Team 6’s project
Click here to view Team 7’s project