| Team Members: | Changling Huang1, Christopher C. Lowman2, Brandon E. Osborne3, and Gabrielle M. Salib4 |
| Graduate Assistants: | Ari Rapkin Blenkhorn4, Jonathan S. Graf5, and Samuel Khuvis5 |
| Faculty Mentor: | Matthias K. Gobbert5 |
| Clients: | Tyler Simon6 and David J. Mountain6 |
1Department of Computer Science, Rutgers University,
2Department of Mathematics, University of Maryland, College Park,
3Department of Physics and Astronomy, Austin Peay State University,
4Department of Computer Science and Electrical Engineering, University of Maryland, Baltimore County,
5Department of Mathematics and Statistics, University of Maryland, Baltimore County,
6Laboratory for Physical Sciences
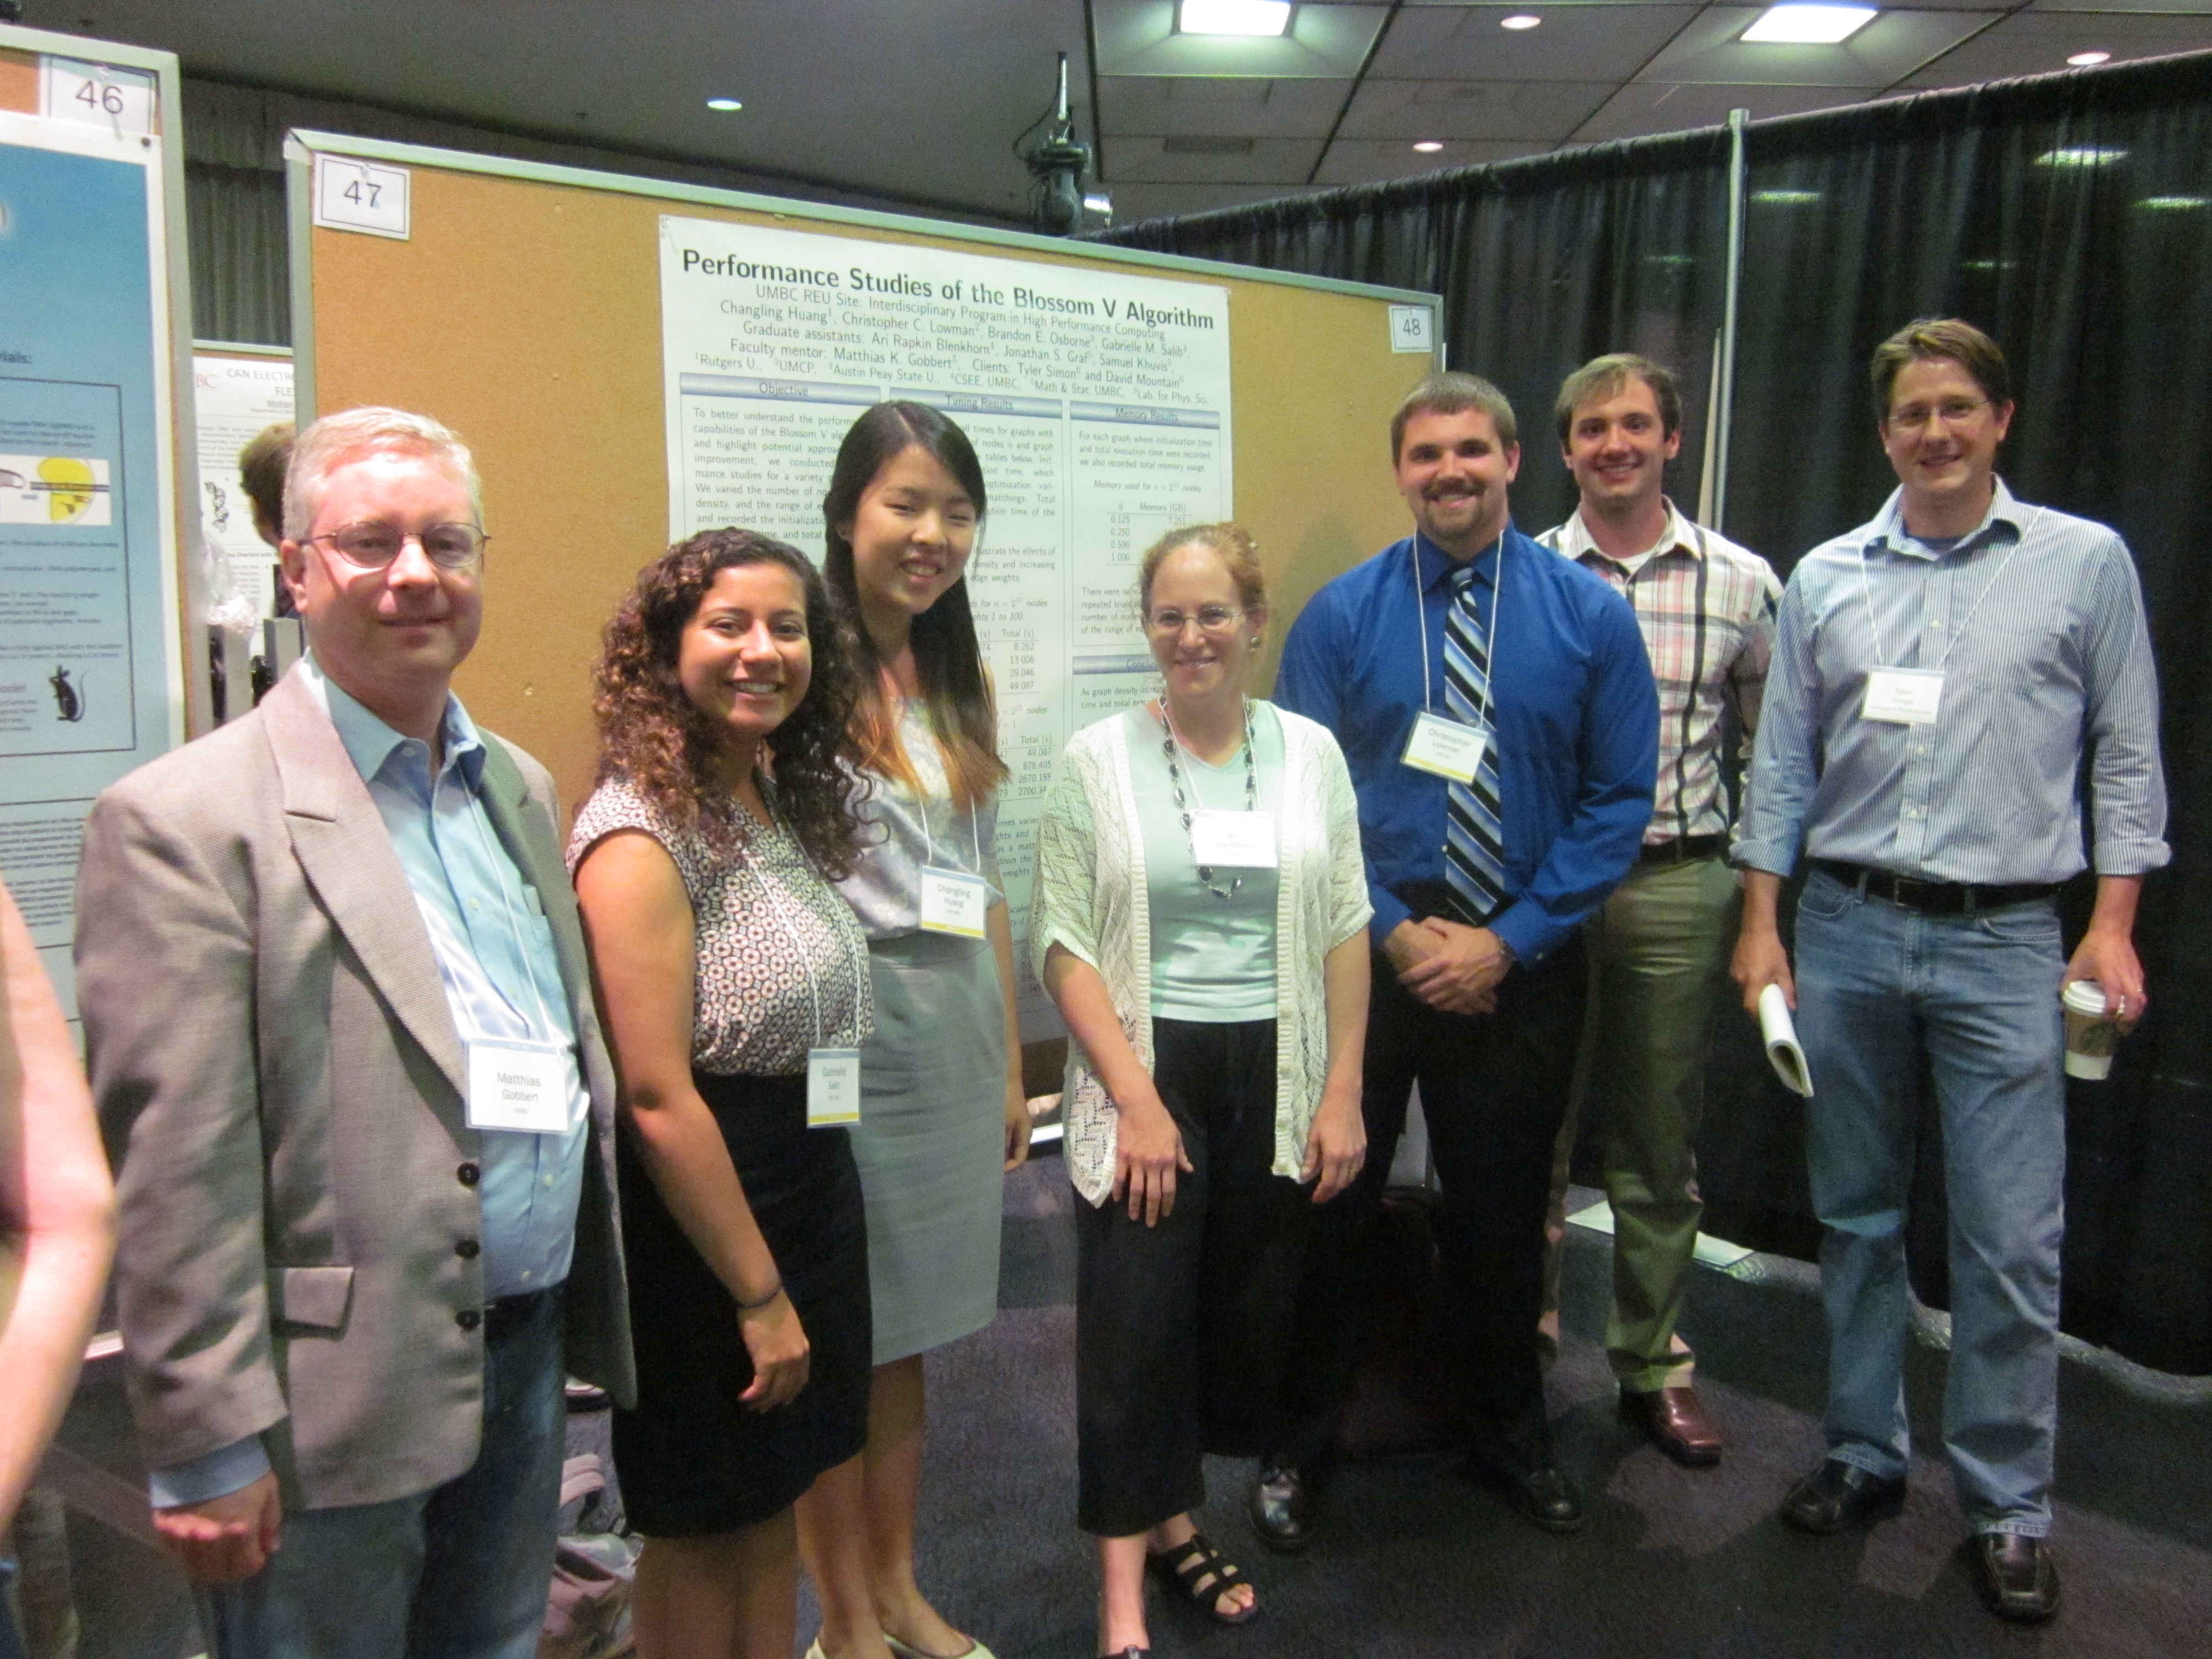
About the Team
Over the course of six weeks we investigated Blossom V, a graph theory matching algorithm, for current performance and potential future parallelization. Our team was itself a perfect matching and consisted of Changling Huang, Christopher Lowman, Brandon Osborne, and Gabrielle Salib, with advising from our faculty mentor, Dr. Matthias Gobbert, and graduate assistant, Ari Rapkin Blenkhorn. The project was proposed by our clients, Tyler Simon and David Mountain.
Summary
To assess the performance characteristics of the Blossom V algorithm and highlight potential approaches for improvement, we conducted performance studies for a variety of graphs. We varied the number of nodes, graph density, and the range of edge weights and recorded the initialization time, total execution time, and total memory usage for each graph.
Blossom V
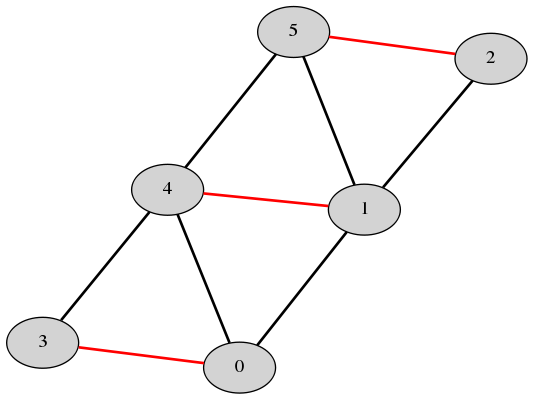
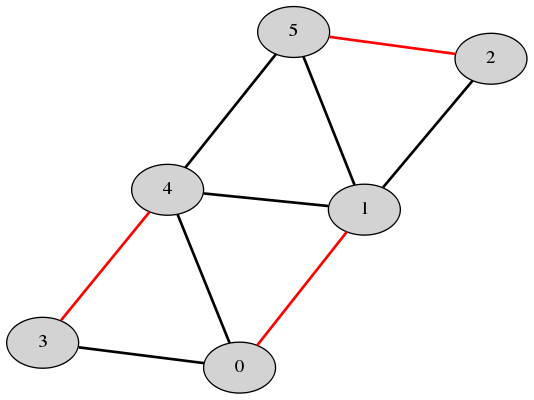
The Blossom algorithm was first introduced in 1965 and has been incrementally improved over time. The most recent version, Blossom V, computes a perfect matching of minimum cost of a graph. Below are examples of perfect matchings, with edges in the matching highlighted in red.
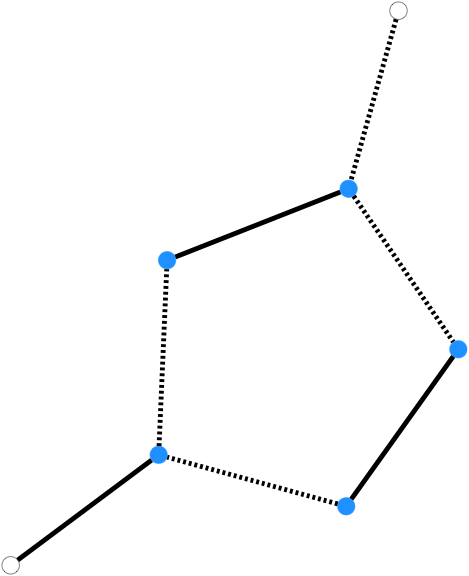
A critical component of the algorithm involves the use of blossoms. A blossom is defined as a cycle of the graph consisting of 2k+1 edges, exactly k of which belong to a matching. Blossoms are shrunk and expanded in order to perform efficient searches on a reduced graph. These operations are represented below.
![]()
Timing Results
We recorded wall times for graphs with various numbers of nodes n and graph densities d. In the tables below, the initialization time includes updating optimization variables and assigning matchings. The total execution time represents the time to run the entire algorithm.
The results below illustrate the effects of increasing graph density and increasing the range of the edge weights.
Time in seconds for 215 nodes with weights 1 to 100
| Density | Initialization Time | Total Execution Time |
| 0.125 | 6.074 | 8.262 |
| 0.250 | 11.207 | 13.006 |
| 0.500 | 27.505 | 29.046 |
| 1.000 | 47.547 | 49.087 |
Time in seconds for n = 215 nodes with density d = 1
| Weight Range | Initialization Time | Total Execution Time |
| 1 – 102 | 47.547 | 49.087 |
| 1 – 104 | 729.372 | 878.405 |
| 1 – 106 | 2649.447 | 2670.155 |
| 1 – 108 | 2677.173 | 2700.346 |
We observed that the times varied for different ranges of weights and investigated whether this was a matter of magnitude. We scaled down the same graphs by their maximum weights to obtain smaller weights.
Scaling speedup (unscaled time / scaled time) for n = 215 nodes with density d = 1
| Weight Range | Speedup (Initialization) | Speedup (Total) |
| 102 – 1 | 0.786 | 0.792 |
| 104 – 1 | 0.858 | 0.914 |
| 106 – 1 | 0.920 | 0.924 |
| 108 – 1 | 0.943 | 0.945 |
Memory Results
For each graph where initialization time and total execution time were recorded, we also recorded total memory usage.
Scaling speedup (unscaled time / scaled time) for n = 215 nodes with density d = 1
| Density | Memory Used (GB) |
| 0.125 | 7.251 |
| 0.250 | 14.498 |
| 0.500 | 28.991 |
| 1.000 | 57.981 |
There were only insignificant disparities between repeated trials of graphs with the same number of nodes and edges, regardless of the range of edge weights.
Conclusions
After analyzing our data, we were able to draw numerous conclusions regarding the performance of the Blossom V algorithm. First, as graph density increases, initialization time and total execution time increase. Second, as the range of edge weights increases, initialization time and total execution time increase; this result could not easily be anticipated and is particular to the blossom algorithm. Third, scaling down the edge weights has no significant effect on initializtion time and total execution time. And finally, memory usage largely depends on the number of nodes and edges in a graph.
We have laid the groundwork for future work, which should focus on parallelization of the algorithm in order to improve run-time performance. Additionally, improvements should be made to the algorithm in order to address the issue of substantially increased run-time that results from having large edge weights. Finally, improvements should be made concerning total memory usage for graphs in order to increase computational problem sizes.
Links
Changling Huang, Christopher C. Lowman, Brandon E. Osborne, Gabrielle M. Salib, Ari Rapkin Blenkhorn, Jonathan S. Graf, Samuel Khuvis, Matthias K. Gobbert, Tyler Simon, and David J. Mountain. Performance studies of the Blossom V algorithm. Technical Report HPCF-2015-26, UMBC High Performance Computing Facility, University of Maryland, Baltimore County, 2015. (HPCF machines used: maya.). Reprint in HPCF publications list
Poster presented at the Summer Undergraduate Research Fest (SURF)
Click here to view Team 1’s project
Click here to view Team 2’s project
Click here to view Team 3’s project
Click here to view Team 4’s project
Click here to view Team 5’s project
Click here to view Team 7’s project
Click here to view Team 8’s project