| Team Members: | Christopher Evans1, Abigail Gartrell2, Lauren Gomez3, Moise Mouyebe4, and Darius Oxley5 |
| Graduate Research Assistant: | Sai Kumar Popuri5 |
| Faculty Mentor: | Nagaraj K. Neerchal5 |
| Client: | Amita Mehta6 |
1Department of Mathematics, Hampden-Sydney College,
2Department of Mathematics, University of Maryland, College Park,
3Department of Mathematics, California State Polytechnic University, Pomona,
4Department of Mathematics, University of Michigan, Flint,
5Department of Mathematics and Statistics, University of Maryland, Baltimore County,
6Joint Center for Earth Systems Technology (JCET) and Geography and Environmental Systems, University of Maryland, Baltimore County
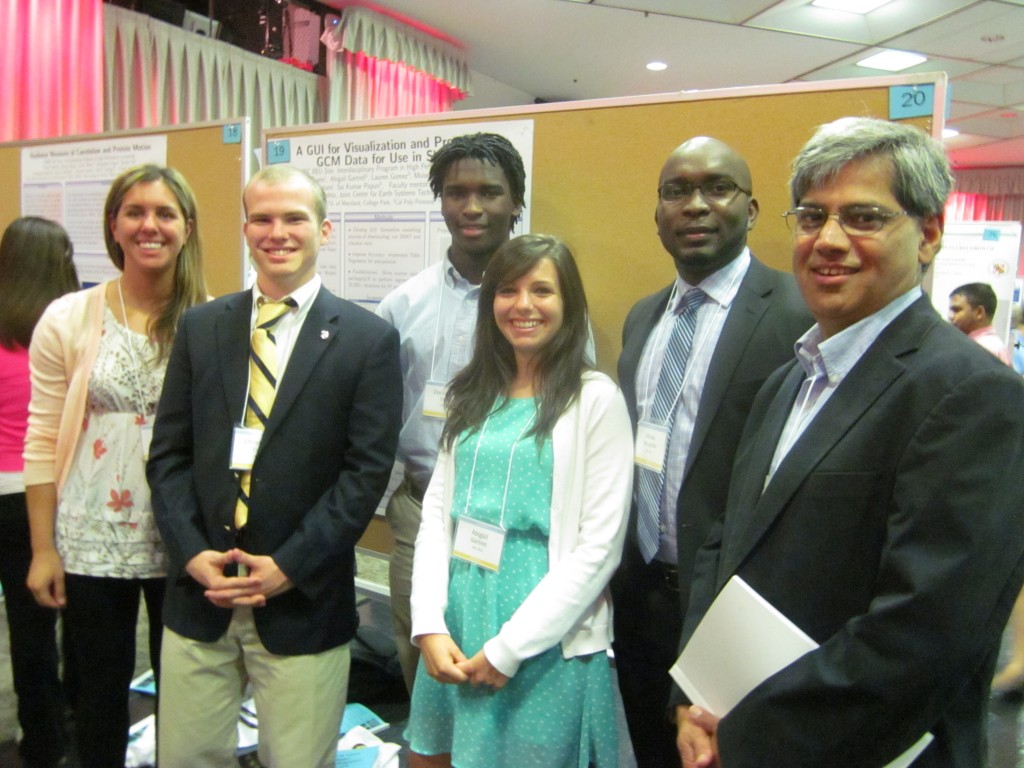
Team 2, from left to right: Lauren Gomez, Christopher Evans, Darius Oxley, Abigail Gartrell, Moise Mouyebe, Nagaraj K. Neerchal.
About the Team
Our team, composed of Christopher Evans, Abigail Gartrell, Lauren Gomez, Moise Mouyebe, and Darius Oxley, developed a Graphic User Interface (GUI) tool using R programming, a popular statistical computing language, and improved the efficiency of our routines. This research took place at the UMBC REU Site: Interdisciplinary Program in High Performance Computing. Our faculty mentor, Dr. Nagaraj Neerchal, and our research assistant, Sai Popuri, aided us in our research. Our client, Dr. Amita Mehta, Joint Center for Earth Systems Technology (JCET) and Geography and Environmental Systems, proposed our project and provided us with data that was used in the routines of our study.
Our Project
The USDA-NIFA supports the endeavor to assess the impacts of natural decadal climate variability on agricultural yields in the Missouri River Basin (MRB).The UMBC-JCET team uses data provided by Global Climate Models (GCMs), specically MIROC5. The GCM data is used to generate input to the Soil, Water Assessment Tool (SWAT), a modeling tool that predicts long term agricultural yields.
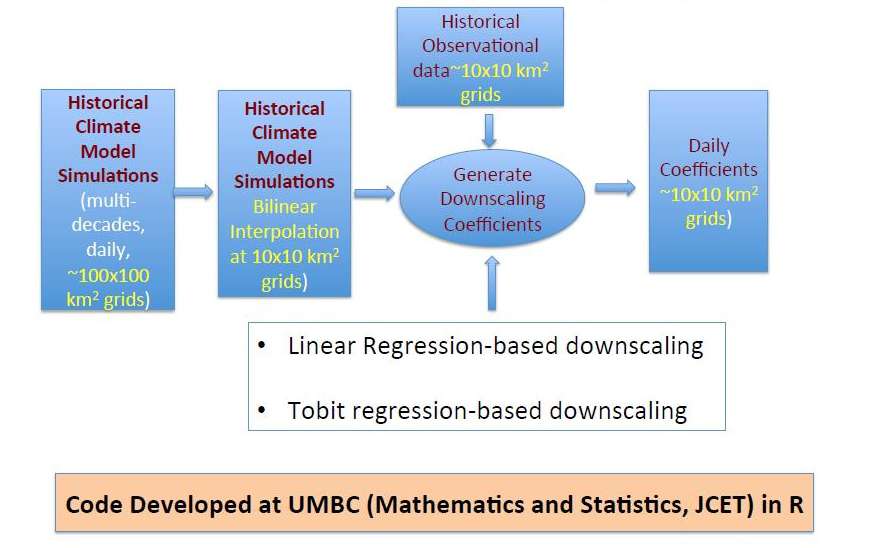
Figure 1Our project involves streamlining the computational procedure of the above figure, which depicts the steps necessary in downscaling the high resolution MIROC5 data, and generating appropriate visualization. We also want to improve computational effciency.
Methods and Results
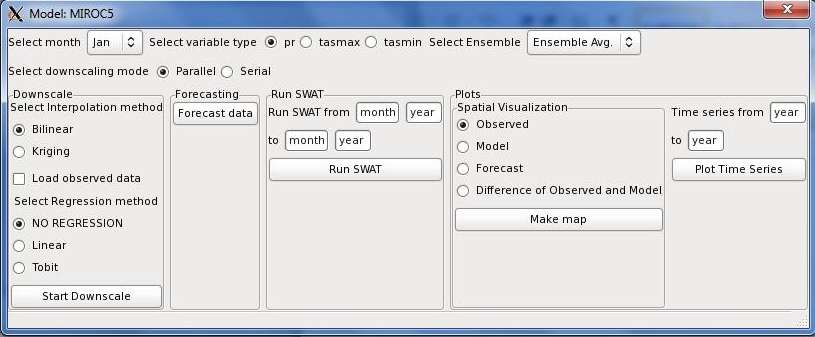
Figure 2We developed a GUI tool to streamline modelling process of downscaling, run SWAT and visualize data. We also improved the accuracy of the precipitation data by implementing Tobit Regression, which accounts for data where most of the values are zeroes. In addition, we used the SNOW library in order to parallelize both the regression routine, and the generation of ensemble data using parSapplyLB. The regression routine perfroms regression at 30,000+ locations for 57 years.
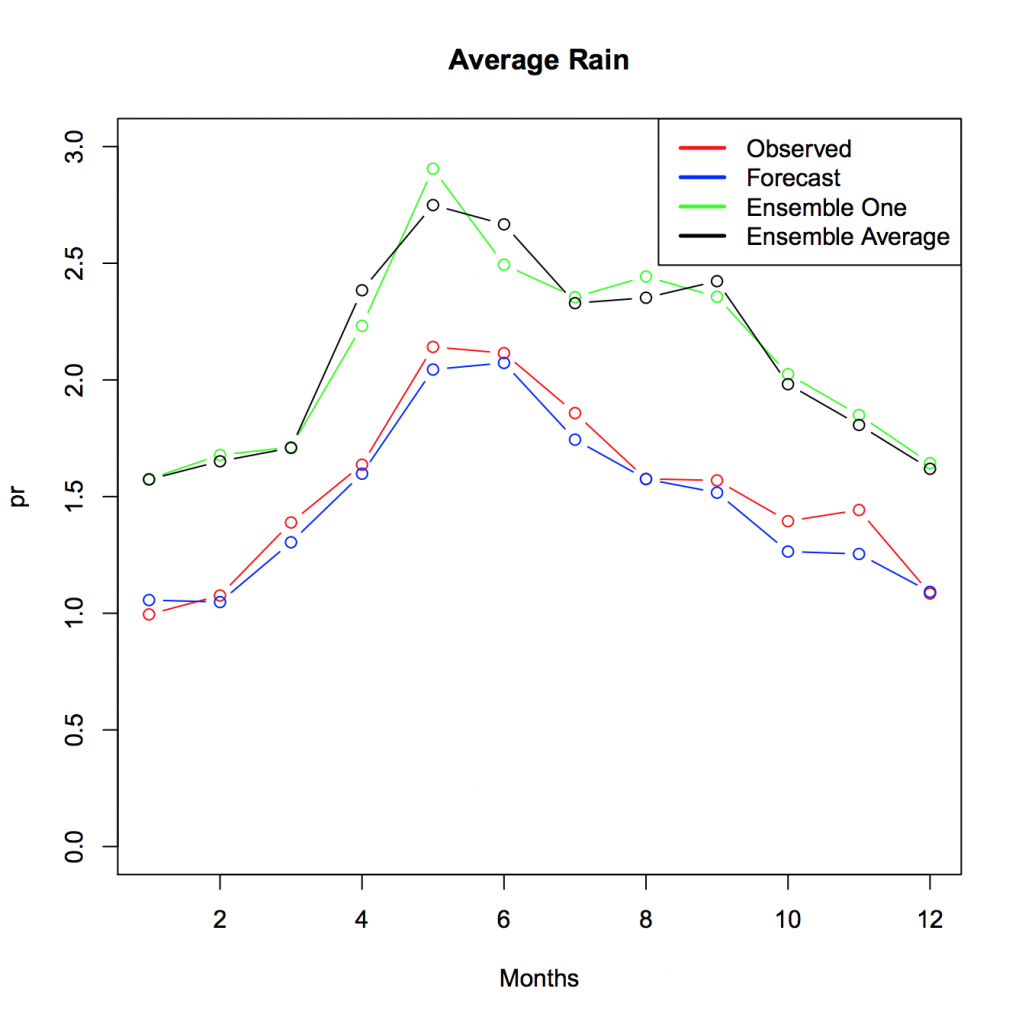
Figure 3The plot above depicts the averages of precipitation data for the twenty year period of 1981 to 2000 and all locations in the MRB region of the different models. The forecasted data, generated from the average ensemble data, after using Tobit regression is very close to the observed data from the same time period. It can also be observed that averaging the ensembles tempers the ensemble data, in this case ensemble one.
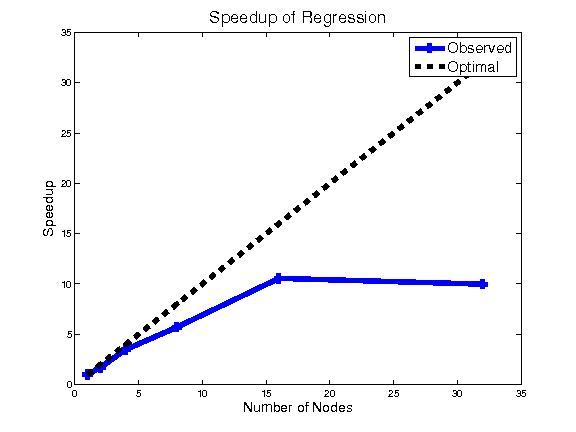
Figure 4As it can be seen from the figure above, the dashed black line is the optimal speed up of parallelizing code, while the blue line depicts our actual speed up using a number of different nodes. We achieved speed up using parallelization of the regression routine.
Links
Christopher Evans, Abigail Gartrell, Lauren Gomez, Moise Mouyebe, Darius Oxley, Sai Kumar Popuri, Nagaraj K. Neerchal, and Amita Mehta.Improving the Computational Efficiency of Downscaling GCM Data for Use in SWAT. Technical Report HPCF-2014-12, UMBC High Performance Computing Facility, University of Maryland, Baltimore County, 2014. (HPCF machines used: maya.). Reprint in HPCF publications list
Poster presented at the Summer Undergraduate Research Fest (SURF)
Click here to view Team 1’s project
Click here to view Team 3’s project
Click here to view Team 4’s project
Click here to view Team 5’s project