| Team Members: | William J. Bailey1, Claire A. Chambless2, Brandynne M. Cho3, and Jesse D. Smith4 |
| Graduate Research Assistant: | Andrew M. Raim4 |
| Faculty Mentor: | Kofi P. Adragani4 |
| Client: | Ian F. Thorpe5 |
1Department of Mathematics and Statistics, Kenyon College,
2Department of Mathematical Sciences, Elizabethtown College,
3Department of Mathematics and Computer Science, Saint Mary’s College of California,
4Department of Mathematics and Statistics, University of Maryland, Baltimore County,
5Department of Chemistry and Biochemistry, University of Maryland, Baltimore County

Team 2, from left to right: William J. Bailey, Claire A. Chambless, Jesse D. Smith
About the Team
Our team – William Bailey, Claire Chambless, Brandynne Cho, and Jesse Smith – wrote a program to analyze Molecular Dynamics (MD) simulation data, to look for correlated motion. The program used Principal Fitted Components (PFC) statistical methodology. The research took place during the summer of 2013 at the UMBC REU Site: Interdisciplinary Program in High Performance Computing. Supervising our work and providing assistance were faculty advisor Dr. Kofi P. Adragni and graduate assistant Andrew M. Raim. Our client, Dr. Ian F. Thorpe, faculty in the Department of Chemistry and Biochemistry at UMBC, proposed the project.
Project Introduction
Complex data are routinely generated by researchers across the applied sciences. These data create challenges for analysis due to their high dimensionality. Molecular Dynamics (MD) simulations are a good example; they generate large, high dimensional datasets that pose a challenge for analysis. This project was motovated by the study of allostery, the process by which an event at one location in a biomolecule affects the properties of another location. MD simulaions can readily reproduce this phenomenon, but do not address the problem of data analysis. We implemented a powerful dimension reduction methodology called Principal Fitted Components (PFC).
Principal Fitted Components
To uncover allosteric interactions in the data, we search for atoms whose motions over time are correlated. Dimension reduction methodology is used to find these correlations. These methods use the assumption that the pairs of atoms with the greatest motion are of interest. The analysis methods used previously were only able to find linearly correlated motion among the atoms. This may not be able to capture higher-order associations, if they exist. PFC is able to capture a range of nonlinear associations in addition to linear correlations; polynomial, Fourier, and piecewise functions can all be fit to the data.
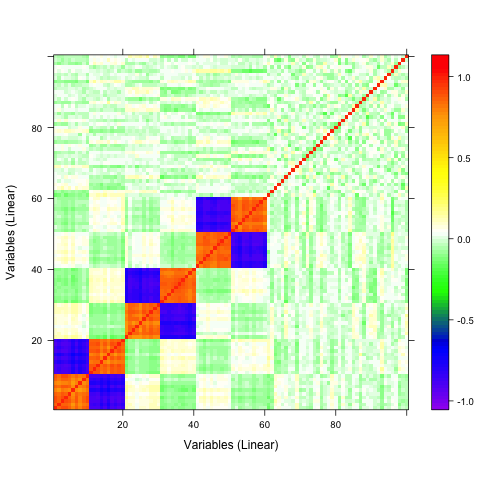
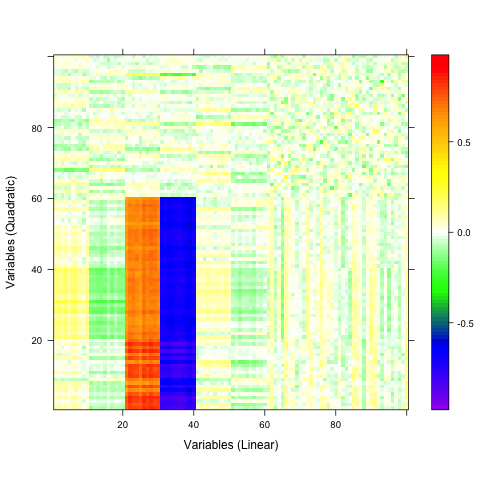
A qualitative tool called a correaltion map is often used when searching for correlations between atoms. The plot is a false-color plot that systematically lists the correlations between each pair of atoms. Figures 1a and 1b show the linear and quatratic correlations between a simulated data set of 100 variables. There are underlying linear and quadratic correlations that exist in the data due to how it was generated. Figure 1c shows a combination of linear and quadratic associations.
 |
 |
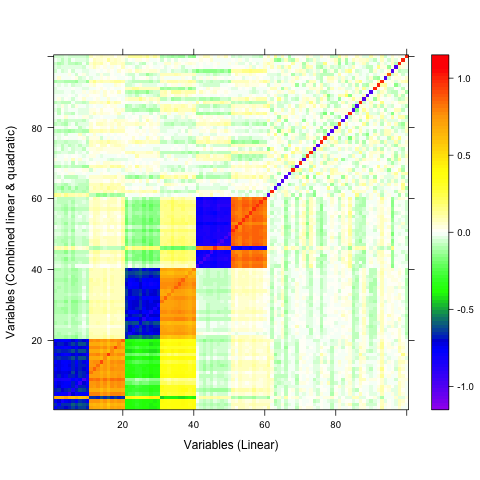 |
| 1a | 1b | 1c |
Figure 1
Parallel Implementation
Parallization of the PFC analysis allows much larger data sets to be analyzed effectively. We wrote a wrapper to implement the ‘pfc’ function in the R library ‘ldr’. The wrapper allowed the computation to be distributed across many processes, greatly reducing the time required for analysis. There are some special interpretations of the MD simulation data since it is both a time series and from a physical system. The reactions of each atom to the movement of its neighbors may not be instanteneous; this makes finding correlations slightly more difficult. We overcame this by implementing a method of comparing observations of atoms at slightly different times. The method considers all observations within a specified maximum time lag. The greatest correlations observed over the time lag were collected into a map like those in Figure 1.
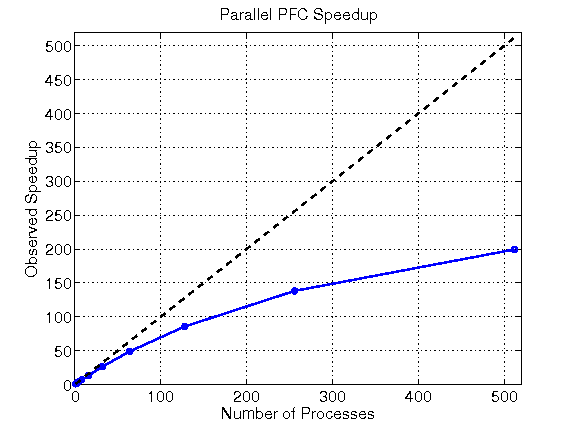
The parallel PFC program proved to be quite efficient, reducing a serial time of 2 hours 22 minutes to under 1 minute on 512 processes. We ran a performance study using a sample MD data set; a matrix with 531 columns and 100 rows. The program displayed nearly linear speedup until reaching very high numbers of processes (see Fig 2). The performance study demonstrated the program’s scalability; it can be run on effectively on machines of many sizes.
 |
|
||||||||||||||||||||||
| Figure 2 | Table 1 |
Links
William J. Bailey, Claire A. Chambless, Brandynne M. Cho, Jesse D. Smith, Andrew M. Raim, Kofi P. Adragani, Ian F. Thorpe. Identifying Nonlinear Correlations in High Dimensional Data with Application to Protein Molecular Dynamics Simulations. Technical Report HPCF-2013-12, UMBC High Performance Computing Facility, University of Maryland, Baltimore County, 2013. Reprint in HPCF publications list
Poster presented at the Summer Undergraduate Research Fest (SURF)
Click here to view Team 1’s project
Click here to view Team 3’s project
Click here to view Team 4’s project