| Team Members: | Jordan B. Angel1, Amy M. Flores2, Justine S. Heritage3, and Nathan C. Wardrip4 |
| Graduate Assistant: | Andrew M. Raim5 |
| Faculty Mentor: | Dr. Matthias K. Gobbert5 |
| Client: | Richard C. Murphy6, David J. Mountain7 |
1Department of Mathematics and Statistics, East Tennessee State University,
2Department of Mathematics and Statistics, Grinnell College,
3Department of Mathematics and Computer Science, Dickinson College,
4Department of Mechanical Engineering, Saint Cloud State University,
5Department of Mathematics and Statistics, University of Maryland, Baltimore County,
6Sandia National Laboratories,
7Advanced Computing Systems Research Program

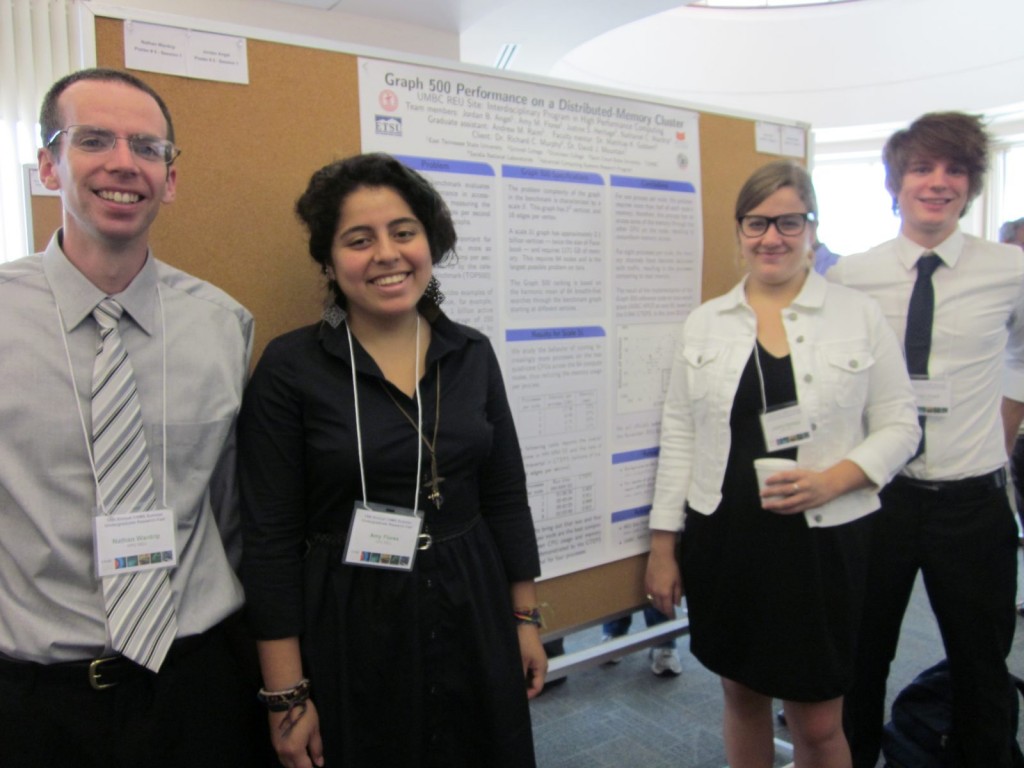
Team 1, from left to right: Nathan Wardrip, Amy Flores, Justine Heritage, Jordan B. Angel
About the Team
Our team of four undergraduates, Jordan B. Angel, Amy M. Flores, Justine S. Heritage, and Nathan C. Wardrip, executed the memory-intensive Graph 500 benchmark and researched the compute node architecture used at UMBC to explain our results. This research is part of the REU Site: Interdisciplinary Program in High Performance Computing 2012 hosted by the Department of Mathematics and Statistics at University of Maryland, Baltimore County. Our team was mentored by Dr. Matthias K. Gobbert and graduate assistant Andrew M. Raim. The problem was posed and supported by Richard C. Murphy of Sandia National Laboratories and David J. Mountain of Advanced Computing Systems Research Program.
UPDATE: UMBC’s tara Officially Ranked at 98 on Graph 500 in November 2012!
An increasing number of modern computational problems involve the analysis of large data. These data problems place enormous pressure on a computer’s memory and its capabilities to read and write memory quickly. The Graph 500 benchmark (www.graph500.org) is a benchmark that aims to measure these capabilities, in order to compare various machines, similar to the popular LINPACK benchmark used to rank computers for the TOP500 benchmark (www.top500.org). Our project includes executing the Graph 500 benchmark on the distributed-memory cluster tara in the UMBC High Performance Computing Facility (HPCF) and explaining, scientifically the performance of the code on the machine architecture.
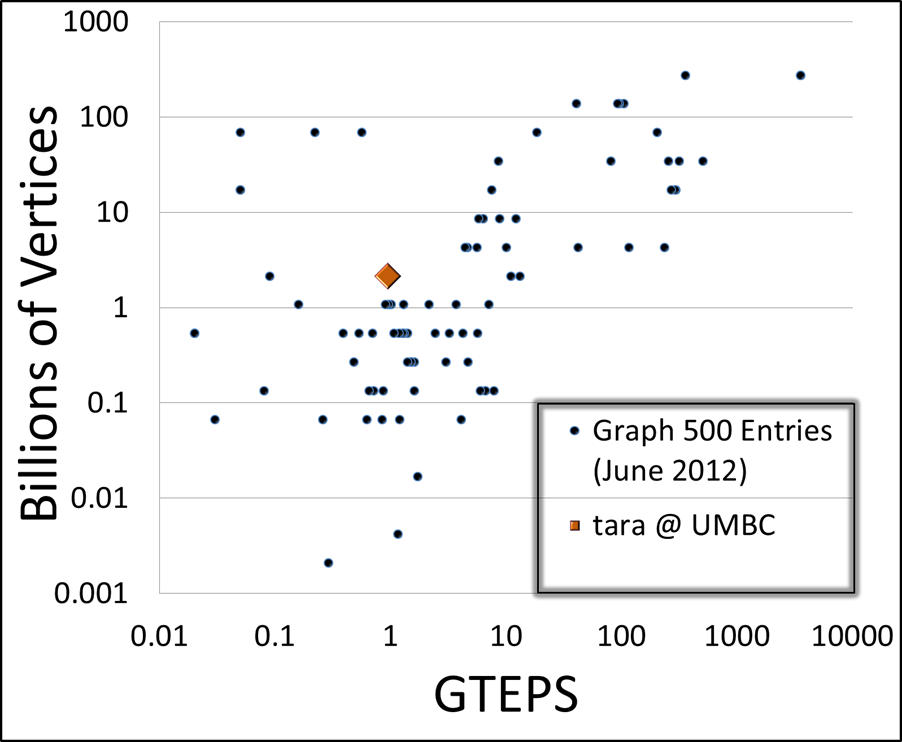
Based on the best result, 0.946 GTEPS, tara would rank 58 in the June 2012 Graph 500 list, as shown in the figure below.
We will officially submit our results to the November 2012 Graph 500 ranking.

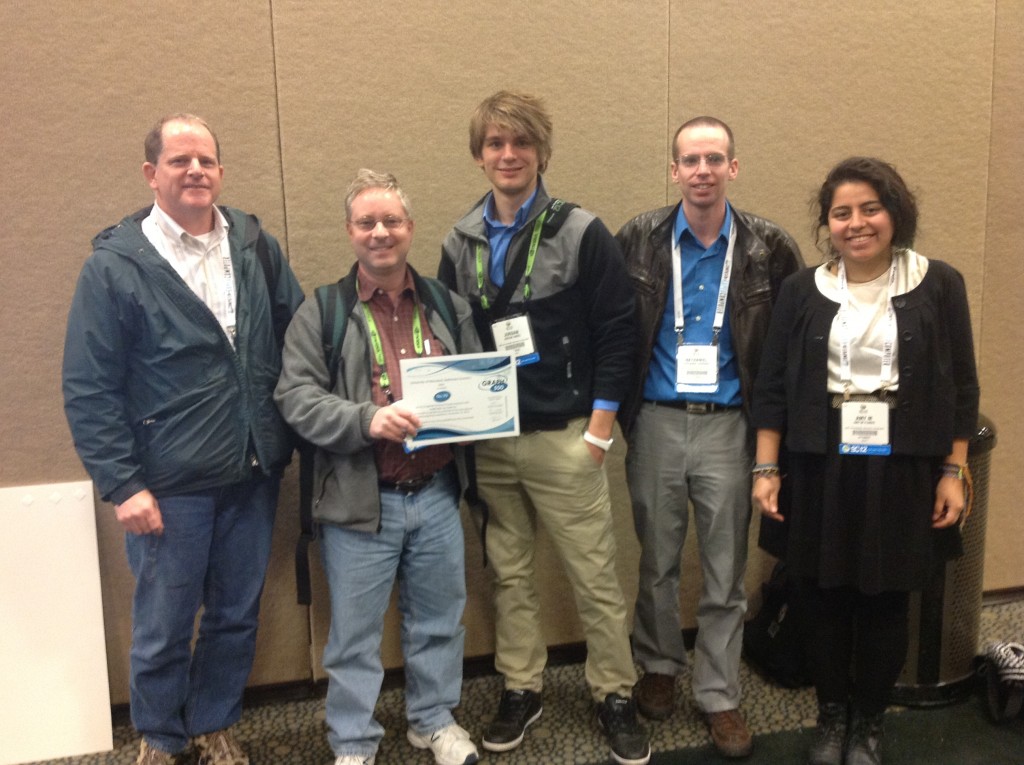
Scatter plot showing tara’s position among the June 2012 Graph 500 entries.UPDATE: Our submission to the November 2012 list was accepted and tara was ranked 98 out of 123 entries. This ranking was announced at the Supercomputing conference in November 2012 in the Birds-of-a-Feather session “Fifth Graph500 List.” Three undergraduate student team members Jordan Angel, Nathan Wardrip, and Amy Flores were able to travel to the conference and met with faculty mentor Dr.~Matthias Gobbert and client David Mountain.

Pictured are (left to right) the client David Mountain, mentor Dr.~Matthias Gobbert, and students Jordan Angel, Nathan Wardrip, and Amy Flores, holding the official certificate for the ranking.Not able to join them at the conference were team member Justine Heritage, graduate assistant Andrew Raim, and client Richard Murphy. We acknowledge funding support for the student travel from the National Security Agency and the National Science Foundation. — See the journal paper referenced below for more information and interpretation of the November 2012 results.
The Graph 500 Benchmark
The Graph 500 benchmark generates a large, random graph. Starting from a single source vertex, a timed breadth-first search is performed to traverse the entire graph. The number of traversed edges are recorded in order to calculate the traversed edges per second (TEPS), a rate that measures the efficiency of the memory access on the compute nodes in conjunction with their network interconnect. This result, reported in billions of traversed edges or GigaTEPS (GTEPS), is what determines the ranking in the Graph 500 ranking. The graph considered in the benchmark is randomly created and its size is characterized by scale S with 2S vertices and 16 edges per vertex. The benchmark requires process and node numbers as powers of 2. The GTEPS reported in the rankings are the harmonic mean of 64 breadth-first searches using different vertices as starting point.
Social Networking sites, such as Facebook, are examples of large graphs. For instance, Facebook reports, as of July 2012, approximately 1 billion active users, each with an average of 150 friends. Each user is represented by a vertex, and “friendships” are represented by edges per vertex.
Hardware Details
The benchmark was executed on the distributed-memory cluster, tara, in UMBC’s High Performance Computing Facility (HPCF). The cluster, tara is a collection of 82 compute nodes with two quad-core Intel Nehalem X5550 processors and 24 GB of memory each. All nodes are connected to each other and to the 160 TB central storage by a high performance InfiniBand (quad data rate) interconnect.
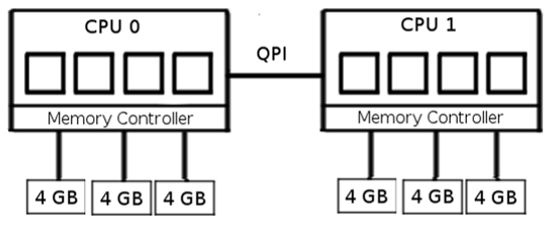
CPUs within compute nodes have three memory channels each connected to one 4 GB DIMM. CPUs within the node are connected by Intel’s QuickPath Interconnect (QPI).

This figure shows the relevant architecture of a single compute node on tara.
Results
| Processes | Memory per | Memory | HH:MM:SS | GTEPS |
| per node | process (GB) | used | ||
| 1 | 17.36 | 72% | 01:06:39 | 0.605 |
| 2 | 8.95 | 37% | 00:45:04 | 0.911 |
| 4 | 4.75 | 20% | 00:42:55 | 0.946 |
| 8 | 2.71 | 11% | 01:03:48 | 0.621 |
The table summarizes the results from a scale 31 problem. This is the largest Graph 500 problem that can be run on tara and requires the combined memory of 64 nodes. Note that a scale 31 graph has about 2.1 billion vertices which is twice the size of Facebook!
In terms of the memory usage per process, displayed in columns two and four, we see the usage decrease by about a factor of two. For the runtime and GTEPS (columns four and five), this expected behavior does not occur. It is clear from that the best performance is achieved two and four processes per node. This can be explained by examining the architecture of the compute node. Each CPU has access to half of the node’s 24 GB of memory through 3 memory channels, each connected to one 4 GB DIMM. The table indicates that a scale 31 problem requires at least 17 GB memory on each node, which is more than the memory associated with one CPU. When running one process per node, this process must communicate via the other CPU to access some of the required memory, leading to nonuniform memory access and resulting inefficiency. By using two processes per node, one on each CPU, they can access necessary memory through dedicated memory channels. At eight processes, all memory channels are saturated so processes must compete to retrieve memory. This accounts for the sharp decline in performance. Overall, four processes per node provides the best compromise between CPU usage and memory access.
Links
Jordan B. Angel, Amy M. Flores, Justine S. Heritage, Nathan C. Wardrip, Andrew Raim, Matthias K. Gobbert, Richard C. Murphy, and David J. Mountain. Graph 500 Performance on a Distributed-Memory cluster. Technical Report HPCF-2012-11, UMBC High Performance Computing Facility, University of Maryland, Baltimore County, 2012. Reprint in HPCF publications list
Jordan B. Angel, Amy M. Flores, Justine S. Heritage, Nathan C. Wardrip, Andrew M. Raim, Matthias K. Gobbert, Richard C. Murphy, and David J. Mountain. The Graph 500 Benchmark on a Medium-Size Distributed-Memory Cluster with High-Performance Interconnect. Parallel Computing: Systems & Applications. Submitted. Prepeprint in HPCF publications list
Poster presented at the Summer Undergraduate Research Fest (SURF)
Click here to view Team 2’s project
Click here to view Team 3’s project