| Team Members: | Annie Castner1, Jenny Louthan2, Edwardo Rivera3, and Christian Weigandt4 |
| Graduate Assistant: | Jonathan S. McHenry5 |
| Faculty Mentors: | Dr. Matthias K. Gobbert5 and Dr. Nagaraj K. Neerchal5 |
| Clients: | Dr. Michael Dillon6 |
1Department of Applied & Computational Mathematics and Statistics, University of Notre Dame,
2Department of Mathematical Sciences, Lewis & Clark College,
3Department of Computer Science and of Mathematics, University of Puerto Rico, Rio Piedras Campus,
4Department of Mathematics and Computer Science, High Point University,
5Department of Mathematics and Statistics, University of Maryland, Baltimore County,
6Office of Institutional Research, University of Maryland, Baltimore County
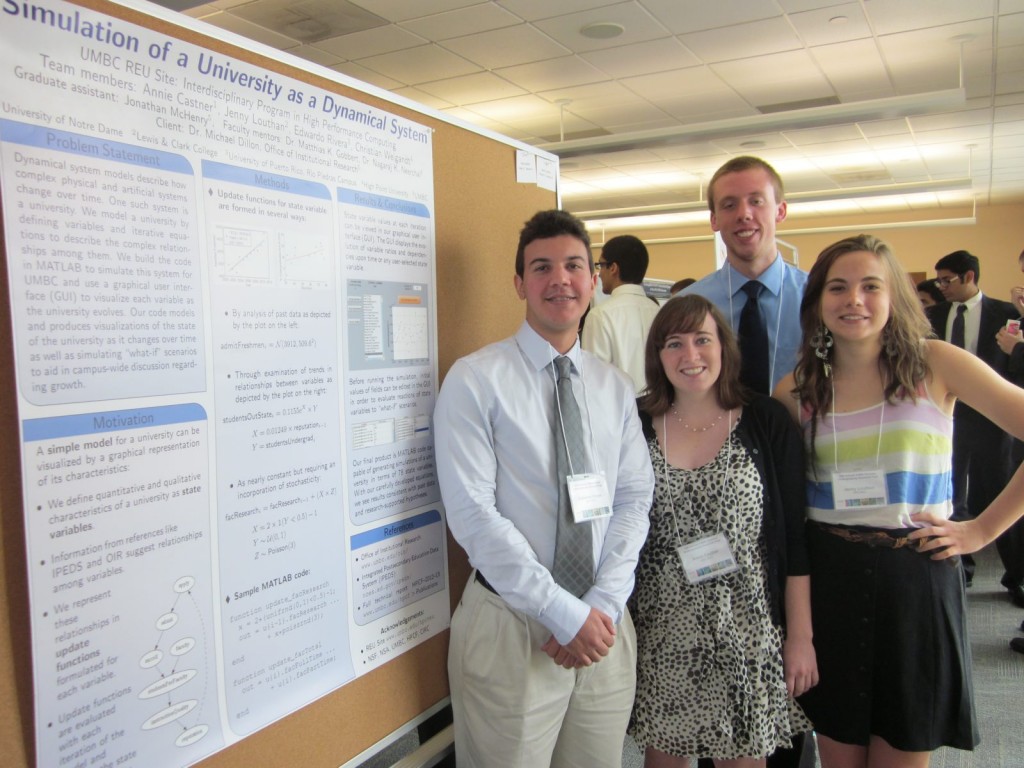
Team 3, from left to right: Edwardo Rivera, Annie Castner, Christian Weigandt, Jenny Louthan
About the Team
Our team — composed of Jenny Louthan, Annie Castner, Christian Weigandt and Edwardo Rivera — created a simulation of a university as a dynamical system. The research took place during the summer of 2012 at the UMBC REU Site: Interdisciplinary Program in High Performance Computing. Supervising our work and providing assistance were faculty advisors Dr. Matthias K. Gobbert and Dr. Nagaraj K. Neerchal and graduate assistant Jonathan S. McHenry. Our client, Dr. Michael Dillon, Director of the Office of Institutional Research of UMBC, proposed the project. 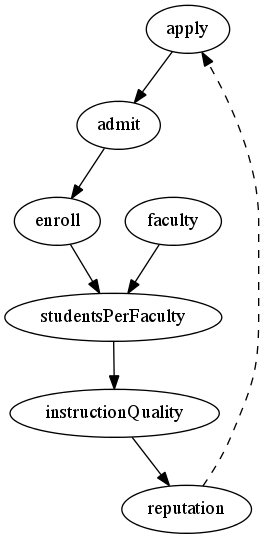
Project Introduction
A university has important features that interact with each other. Characteristics like enrollment, total faculty, student-to-faculty ratio, endowment, and others are important to the university’s reputation. With the approach of a dynamical system — which describe how complex physical and artificial systems change over time — a university can be simulated. Dr. Dillon presented to us a simple model of the university and motivated our simulation of the model with applications specifically defined for UMBC.
We began the project with a simple model of a university, as seen to the right. This model hides much of the interaction and complexity of a more detailed and accurate model but aids in visualizing a university represented as a graph. From this simple model, we expanded the complexity to include over 75 variables. To simulate our model, we created stochastic and deterministic equations to describe relationships among the components, or state variables, of UMBC. We implemented these equations in the MATLAB programming language and created a graphical user interface (GUI) to visualize each state variable at each time step.
Formulating Equations for UMBC
We approached the formulation of our equations with past data from two sources: OIR, which provides yearly data specific to UMBC, and the Integrated-Post Secundary Educational Data System (IPEDS) , which contains public data of every university in the United States that offers financial aid to its students. Refer to our technical report, Section 2.1, for more information on data collection and usage. Due to the availability of the data, and to make our model as realistic as possible, we fit models of these variables to study their behavior and relationships. However, some variables in our model such as reputation and instruction quality are subject to individual interpretation and are thus difficult to measure. For these variables, we researched common techniques for quantifying them. For more information on our equation development, refer to Sections 2.2 and 3.1 in our technical report.
MATLAB Implementation and GUI
Although software exists that is designed specifically for dynamical systems, such as STELLA and OpenModelica, we decided to create our model in MATLAB to have more complete control of the code and implementation of our simulation. Our implementation of the model resulted in
- MATLAB code which simulates UMBC
- A graphical user interface (GUI) to visualize state variables and trends
The intricate handling of variable interactions in our model necessitated writing and employing a system of equations in our MATLAB code. We formulated an update function for each state variable in order to realistically summarize the state of the university at each time step, defined as one year. These functions contain the dependencies among variables as well as varying levels of stochasticity. Our variables are initialized to actual data from UMBC in 2011 in order to make our simulation realistic. By iterating through each variable’s update function, we are able to simulate each component of UMBC.
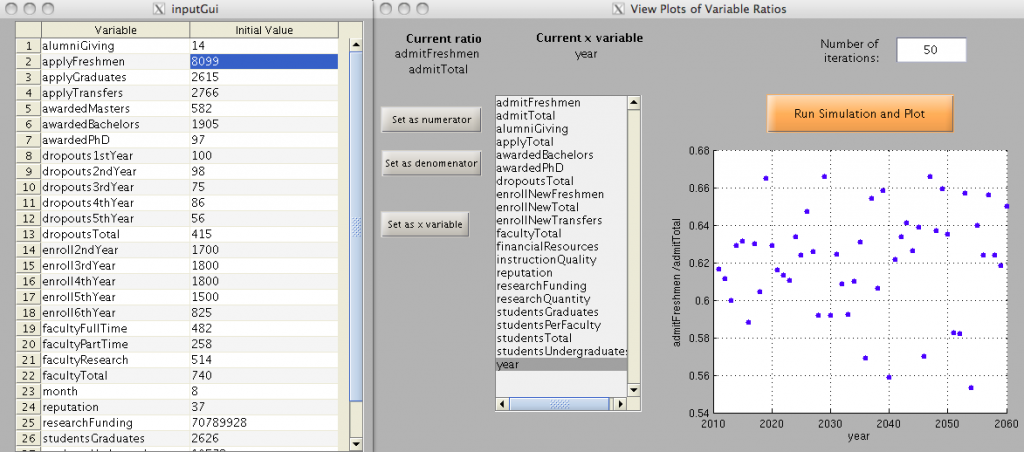
This image gives an example of user interaction with our GUIWith our GUI, as seen above, the user can edit initial values of the state variables which can be used to answer cause-and-effect questions and run “what-if” scenarios. In the above image, for example, our plot shows the percentage of incoming students that are freshmen. By showing plots of state variables, we can visualize the simulation of UMBC over time, allowing the university to see possible reactions to atypical circumstances.
Conclusions and Future Work
Using our model of UMBC, we can gain insight into the nature of complex interactions among components of the university, and the results of our simulation may be used to promote campus-wide growth and discussion.
Possible future work:
- Generalize the model such that it is adaptable to any university
- Use IPEDS to juxtapose characteristics of comparable schools
- Extend the complexity of the model by increasing the scope of our variables and their equations.
Links
Annie Castner, Jenny Louthan, Edwardo Rivera, Christian Weigandt, Jonathan S. McHenry, Matthias K. Gobbert, Nagaraj K. Neerchal, Michael Dillon Simulation of a University as a Dynamical System. Technical Report HPCF-2012-13, UMBC High Performance Computing Facility, University of Maryland, Baltimore County, 2012. Reprint and associated files in HPCF publications list
Poster presented at the Summer Undergraduate Research Fest (SURF)
Click here to view Team 1’s project
Click here to view Team 2’s project