| Team Members: | Joseph U. Emelike1, David Harper2, Charlotte Z. Mann3, and Kwame Owusu-Boaitey4 |
| Graduate Assistant: | Sai Kumar Popuri5 |
| Faculty Mentor: | Nagaraj K. Neerchal5 |
| Client: | Amita Mehta6 |
1Department of Computer Science, Bowie State University,
2College of Engineering and Mathematical Sciences, The University of Vermont,
3Department of Mathematics and Statistics, Carleton College,
4Department of Computer Science and Electrical Engineering, University of Maryland, Baltimore County,
5Department of Mathematics and Statistics, University of Maryland, Baltimore County,
6JCET and GES, University of Maryland, Baltimore County
About the Team
Our team, Joseph U. Emelike, David Harper, Charlotte Z. Mann, and Kwame Owusu-Boatey, updated the Graphical User Interface (GUI) developed by the 2014 Team 2 in the programming language R, and investigated the best methods to predict weather parameters over the Missourri River Basin (MRB). Our project focused on processing weather data from Global Climate Models (GCM) by downscaling and generating predictions of precipitation, minimum and maximum temperature through the use of regression as input to a software that predicts crop and water yields, the Soil and Water Assessment Tool (SWAT).
This research took place at the UMBC REU Site: Interdisciplinary Program in High Performance Computing. Our faculty mentor, Dr. Nagaraj Neerchal, and our research assistant, Sai Popuri, aided us in our research. Our client, Dr. Amita Mehta, Joint Center for Earth Systems Technology (JCET) and Geography and Environmental Systems, proposed our project and provided us with data that was used in the routines of our study.
Problem Posed
Decadal climate variability (DCV) has a significant impact on water resources in the Missouri River Basin (MRB), which, in turn, impacts crop yeilds, in this highly-important agricultural region. The UMBC-JCET team uses data provided by Global Climate Models (GCMs), specifically MIROC5 & HadCM3 to generate input to the Soil and Water Assessment Tool (SWAT), a a river basin scale model that quantifies the impact of climate variability and change on water and agricultural yeilds. Low-resolution (∼100km x 100km) GCM data are interpolated and matched to high-resolution (∼10km x 10 km) observed data, a process referred to as downscaling, as input to SWAT.
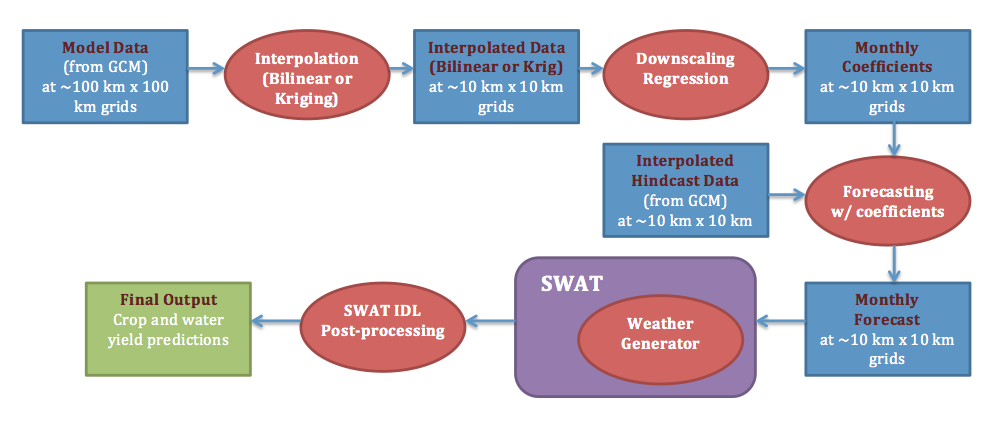
Figure 1
Our major goal first was to streamline the computational procedure outlined by the figure above (Figure 1) and generate appropriate visualizations to facilitate exploratory data analysis. Second, we hoped to improve prediction accuracy through the use of multiple linear regression (MLR), simple linear regression (SLR) and monthly data.
Downscaling
A two-step procedure is used to downscale low-resolution GCM data to match the high-resolution observed data. First, an interpolation method, either bilinear interpolation or kriging is utilized to fill in values at locations where the weather parameters are not available. Second, SLR or MLR is used to capture features of the observed data at the higher resolution. The coefficients from regression are combined with hindcast data from the two GCMs to compute monthly predictions of maximum temperature, minimum temperature, and precipitation to input into SWAT.
We tested an SLR model versus two MLR models. The SLR model is simply the observed parameter (precipitation (Pr), maximinum temperature, or minimum temperature) predicted by the coressponding model parameter, referred to as Model 1. We refer to the MLR models as Model 2 and Model 3 and only use these models to predict precipitation. Model 2 predicts observed precipitation using model precipitation and model average temperature as covariates and Model 3 adds sea-level pressure and surface wind as covariates.
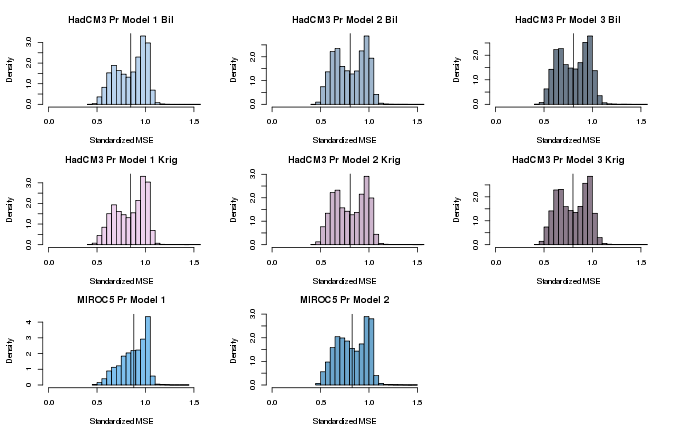
Figure 2
Table 1:
| MIROC5 | HadCM3 | Bil | HadCM3 Krig |
| Pr Model 1 | 0.87931 | 0.84768 | 0.84516 |
| Pr Model 2 | 0.82621 | 0.80628 | 0.80646 |
| Pr Model 3 | NA | 0.80329 | 0.79867 |
| Min Temp | 0.09669 | 0.08004 | 0.08003 |
| Max Temp | 0.07566 | 0.07008 | 0.07015 |
In order to test the models, we calculated a standardized mean square error (MSE) for each location, for which low values are optimal and values above one show a poor fit. Figure 2 shows the distribution of standardized MSE for the models predicting precipitation. Table 1 summarizes this information, with the mean standardized MSE across all locations for each model.
The models do an accurate job predicting minimum and maximum temperature, but the predictions of precipitation are not highly accurate. The two GCM models predict at approximately the same accuracy, although HadCM3 makes slightly better predictions.
We were additionally able to compute the standardized MSE for the predictions of precipitation using daily data (which were computed by the HPCREU Team 2 in 2014), which is .77999. Thus, the predictions made with monthly data using SLR are slightly less accurate, although close.
In general, MIROC5 does a superior job predicting precipitation, although it is still not optimal.
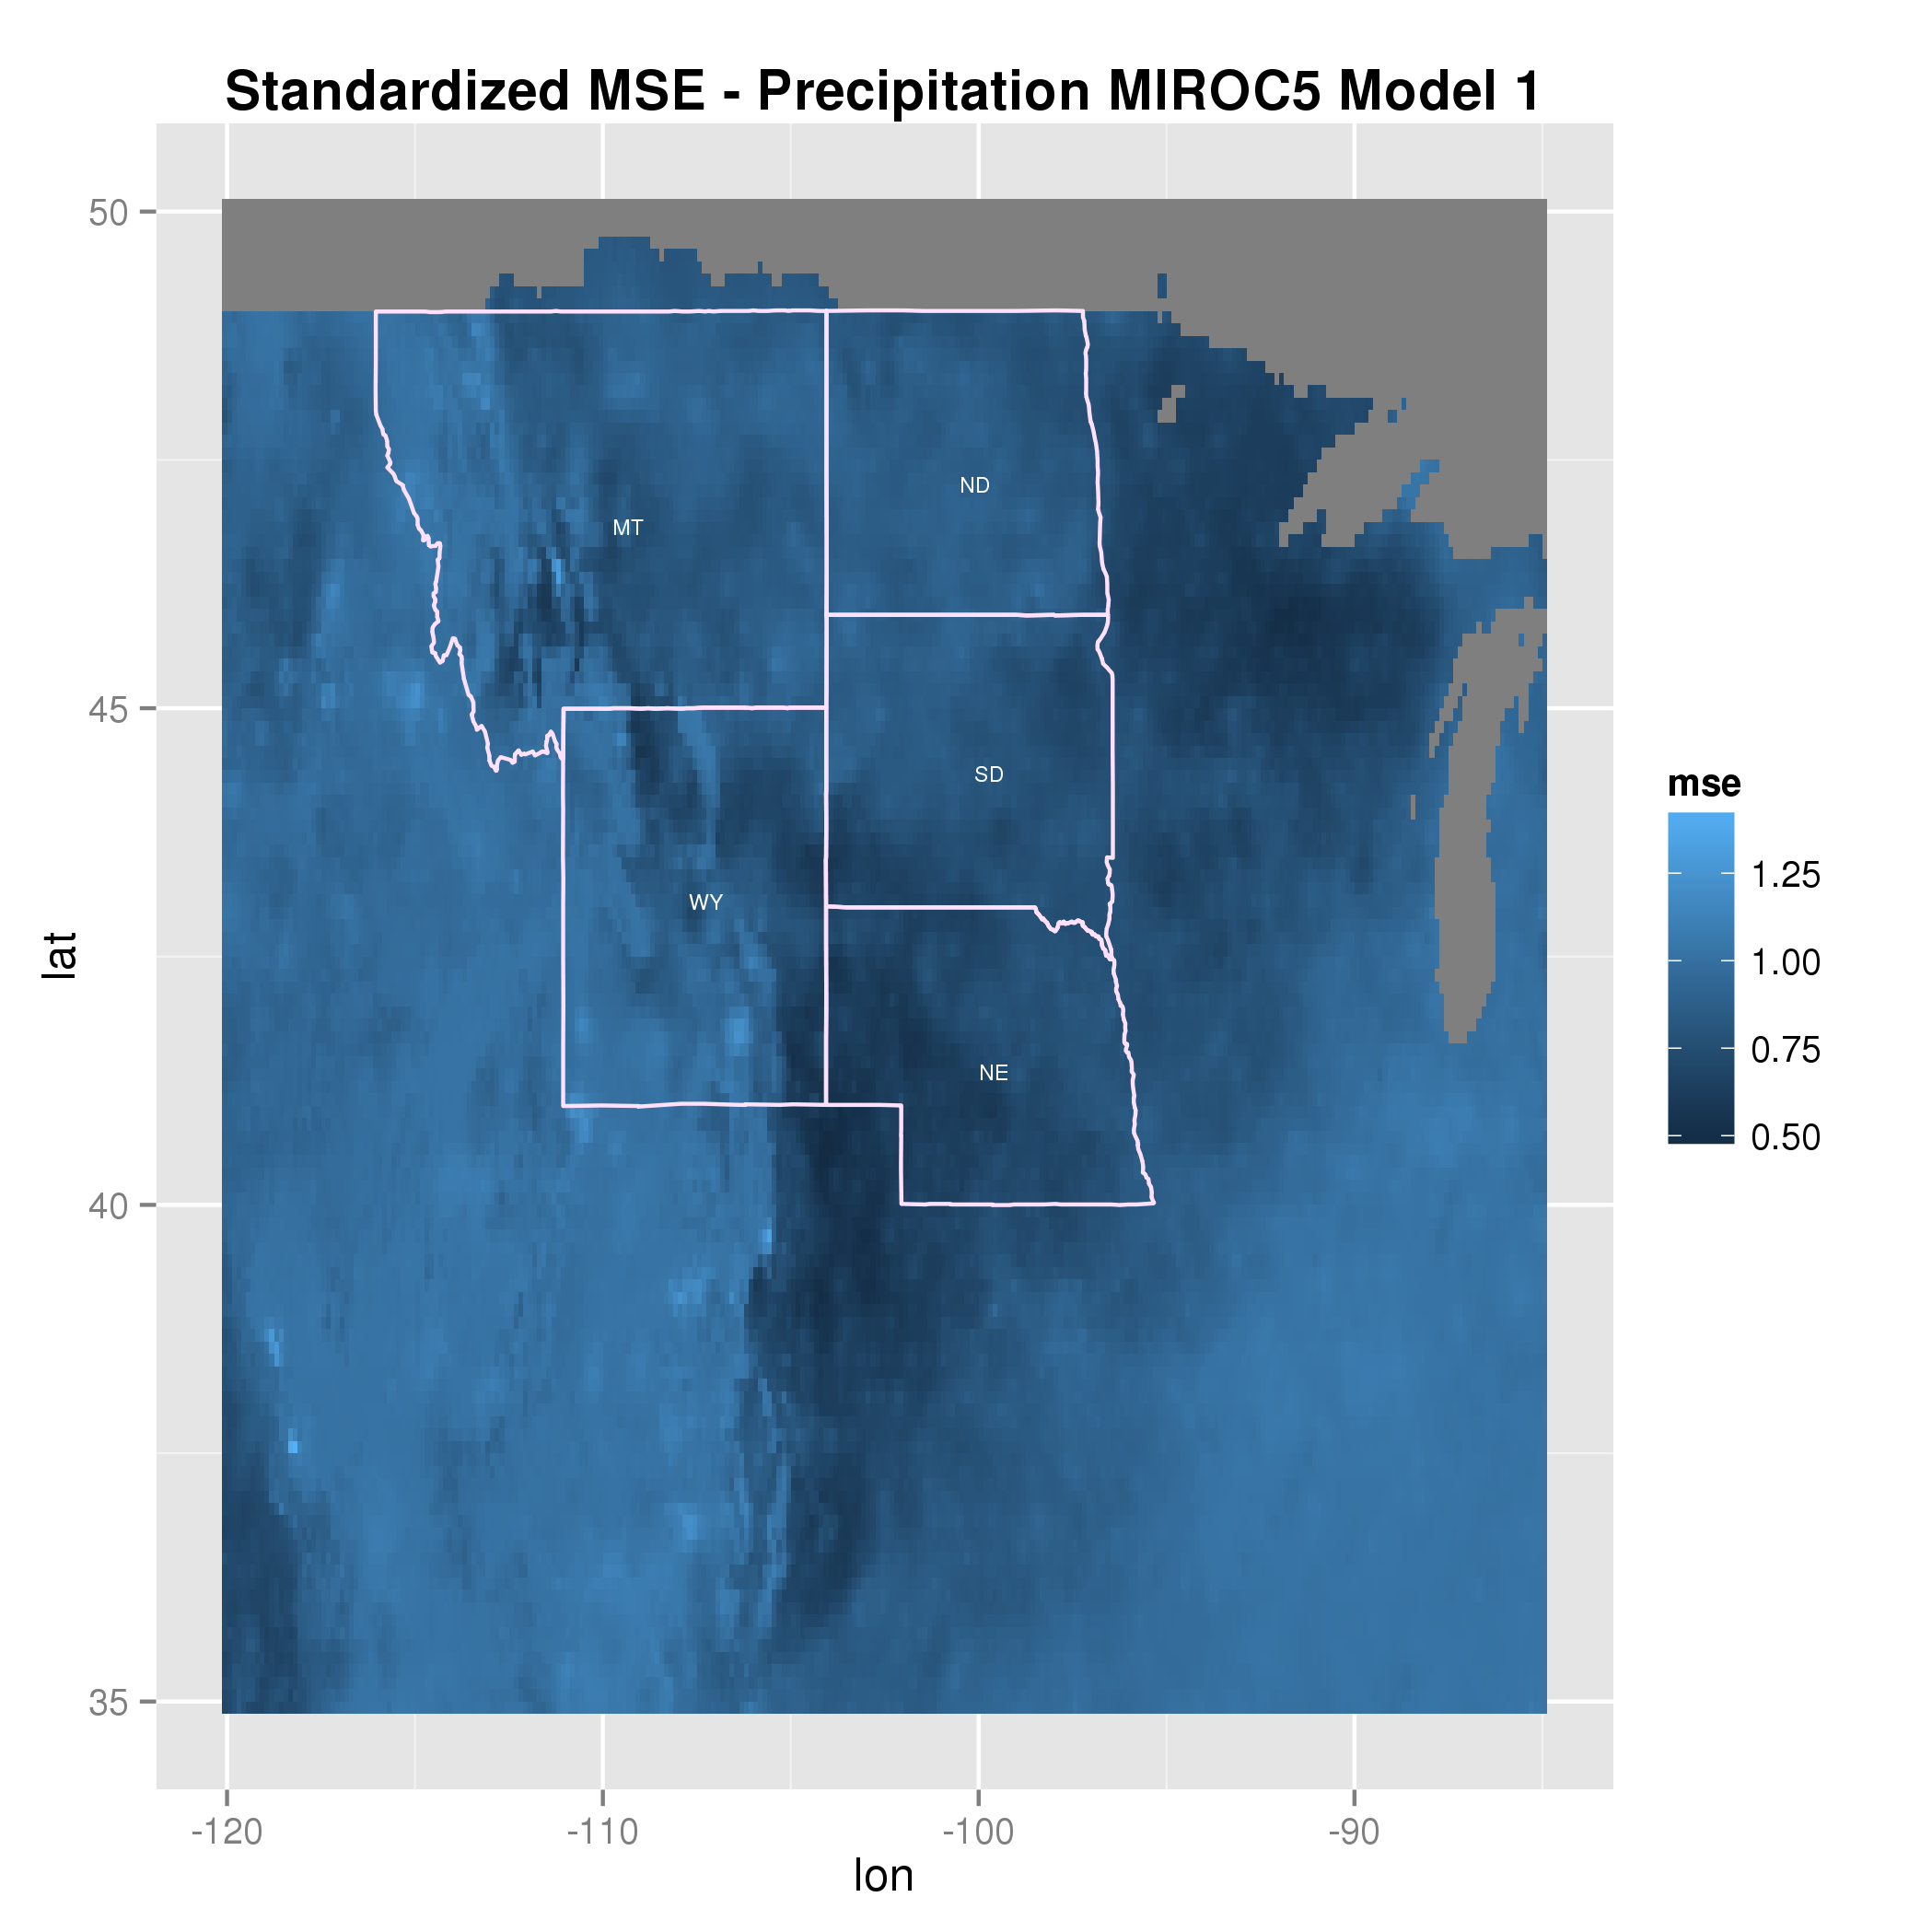
Figure 3
Figure 3 displays the standardized MSE by location for Model 1 with MIROC5 data. We can see that the model generally does well in the area of interest, the MRB, and seems to do poorly outside of this region, especially in mountainous regions. Further research should be done into the effect of geography on predictions of precipitation with these GCM data.
Graphical User Interface
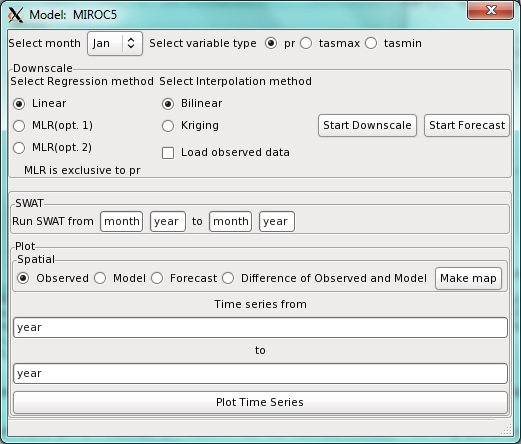
Figure 4
The first major update to the GUI is the adition of the option to use HadCM3 data as well as MIROC5 data. For each model, there is the capability to visualize interpolated weather data, as well as downscaling and forecasting this data for precipitation, minimum temperature, or maximum temperature, using Model 1, Model 2 or Model 3. Also, according to the date ranges specified by the user, the GUI has the option to process monthly data through SWAT and then output this information. Finally, the user can plot the observed data versus the model and forecasted values to compare for one location.
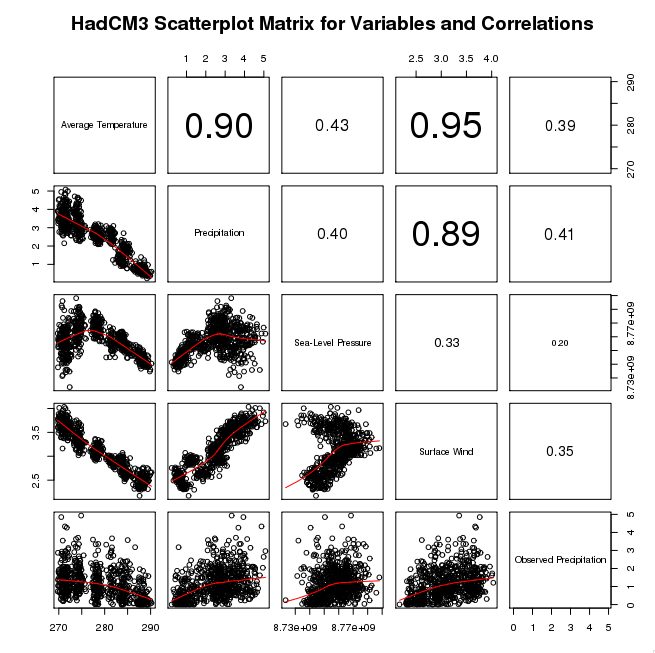
Figure 5
The data visualization aspect of the GUI is broken into two parts: a scatterplot matrix (shown in Figure 5) of the variables and the regression model plotted against time as well as a residual plot. The scatterplot matrix lists the variables along the diagonal, plots the variables against each other on the lower panel of the matrix, and shows the correlations on the upper panel. Next, the plotting of the regression model plots the observed variable against time and shows a line that contains all the regression model predictions. The residual plot simply shows the differences between the observed and predicted values.
Conclusions
The research shows that using monthly data gives predictions that are similar to the predictions using daily data. Using monthly averaged data makes the computations simpler and much faster. Our predictions for minimum temperature and maximum temperature were strong, yielding standardized MSE values less than 0.1 at many locations. However, the predictions were weak for precipitation, yielding high standardized MSE values of 0.8-0.9 at many locations. We did see an increase in prediction strength when adding covariates to the regression models, which is an improvement from previous regression models. Also, both GCM’s offered similar overall predictions, showing that the user is not only limited to using one specific GCM. We successfully developed a GUI to streamline the process of downscaling the data, making predictions, and visualizing the data, which will make research in the future easier and has the potential to be developed into an R package.
Links
Joseph U. Emelike, David Harper, Charlotte Z. Mann, Kwame Owusu-Boaitey, Sai Kumar Popuri, Nagaraj K. Neerchal, and Amita Mehta. Assessing decadal climate impacts on water resources within Missouri river sub-basins. Technical Report HPCF-2015-22, UMBC High Performance Computing Facility, University of Maryland, Baltimore County, 2015. (HPCF machines used: maya.). Reprint in HPCF publications list
Poster presented at the Summer Undergraduate Research Fest (SURF)
Click here to view Team 1’s project
Click here to view Team 3’s project
Click here to view Team 4’s project
Click here to view Team 5’s project
Click here to view Team 6’s project
Click here to view Team 7’s project
Click here to view Team 8’s project