| Team Members: | Wesley Collins1, Daniel T. Martinez1, Michael Monaghan2, and Alexey A. Munishkin3 |
| Graduate Assistants: | Ari Rapkin Blenkhorn1, Jonathan S .Graf4, and Samuel Khuvis4 |
| Faculty Mentor: | Matthias K. Gobbert4 |
| Clients: | John C. Linford5 |
1Department of Computer Science and Electrical Engineering, University of Maryland, Baltimore County,
2College of Earth and Mineral Sciences, The Pennsylvania State University,
3Jack Baskin School of Engineering, University of California, Santa Cruz,
4Department of Mathematics and Statistics, University of Maryland, Baltimore County,
5ParaTools, Inc
About the Team
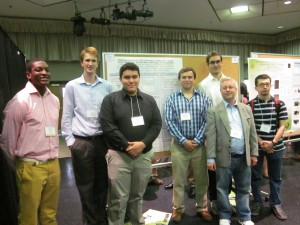
Team 8, composed of Wesley Collins, Daniel Martinez, Michael Monaghan, and Alexey Munishkin, tested six performance analysis tools on combinatorial BLAS .Combinatorial BLAS (CombBLAS) is the C++ implementation of GraphBLAS, which takes graphs and breaks them down into linear algebra so that the computer can run faster. This research took place at the UMBC REU Site: Interdisciplinary Program in High Performance Computing. Our faculty mentor, Dr. Matthias Gobbert, and our research assistant, Samuel Khuvis, aided us in our research. Our client, Dr. John C. Linford from ParaTools Inc., proposed our project and provided us with the resources we needed to complete our study.
Our Project
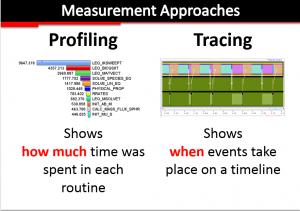
Our client explained to the team the importance of performance analysis tools (PATs) and how they can be used to identify the “hotspots” in the code where it is taking the longest to perform a certain function or command. This can also be called bottle-necking. We evaluated six different PATs and they are Intel VTune, TAU, HPCToolkit, ThreadSpotter, Scalasca, and Score-P. When completing this evaluation, we were given a questionnaire to fill out that asked us questions such as: how difficult was the installation process, were there any costs associated with the software, and how difficult was the instrumentation. We compared the PATs in the context of analyzing an algorithm in CombBLAS (Combinatorial BLAS), a C++ implementation of GraphBLAS which is a set of graph algorithms using BLAS.

Three Examples of Performance Analysis Tools

This is a Graphical User Interface (GUI) that is generated by Intel VTune. This GUI shows the user which functions are taking the longest time to run on the CPU. For Intel VTune in particular, the user may select a function then will be taken inside the function and shown which line of the function is taking the longest.

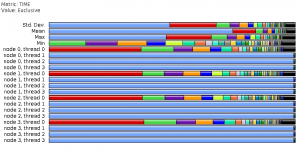
The figure above is from the software TAU. This figure shows the user how active each thread is. The blue means that the thread is waiting or not being used what so ever.
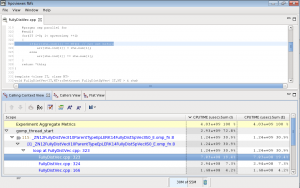
The figure above is from the software HPCToolkit. This figure shows the user which functions are taking the longest time top run on the CPU. The bottom portion contains a red “flame” button that the user can click to enable the tool to find a “hotspot” and displays how much time (both in units of time and percentage of how much in total run time did this function take while the program was running) in the left side of the bottom of the screen. The top portion shows the source code for the highlighted function.
Conclusions
Overall, the analysis tools give the same result, but the way each tool gives the result varies between each PAT. Another difference among the PATs was how the output is displayed. Scalasca for example does not provide a GUI (graphical user interface) unless you download the software Cube. TAU, Intel VTune, HPCToolkit, and ThreadSpotter displayed their output via GUI, while Score-P provides its output through the terminal. Intel VTune and HPCToolkit are event capturing profilers that show which function takes the longest to run and displays the results in a event capturing routine: the hotspot is expanded and displays either a call tree or caller view of how the hotspot was reached. TAU is an in depth profiler that gives the total running time of each function call, but can also be used to give a trace view.
Links
Wesley Collins, Daniel T. Martinez, Michael Monaghan, Alexey A. Munishkin, Ari Rapkin Blenkhorn, Jonathan S. Graf, Samuel Khuvis, Matthias K. Gobbert, and John C. Linford. Comparison of performance analysis tools for parallel programs applied to CombBLAS. Technical Report HPCF-2015-28, UMBC High Performance Computing Facility, University of Maryland, Baltimore County, 2015. (HPCF machines used: maya.). Reprint in HPCF publications list
Poster presented at the Summer Undergraduate Research Fest (SURF)
Click here to view Team 1’s project
Click here to view Team 2’s project
Click here to view Team 3’s project
Click here to view Team 4’s project
Click here to view Team 5’s project
Click here to view Team 6’s project
Click here to view Team 7’s project

