| Team Members: | Jeremy Bejarano1, Koushiki Bose2, Tyler Brannan3, and Anita Thomas4 |
| Faculty Mentors: | Kofi Adragni5 and Nagaraj K. Neerchal5 |
| Client: | George Ostrouchov6 |
1Brigham Young University, Provo, UT
2Brown University, Providence, RI
3North Carolina State University, Raleigh, NC
4Illinois Institute of Technology, Chicago, IL
5University of Maryland, Baltimore County, Baltimore, MD
6Oak Ridge National Laboratory, Oak Ridge, TN

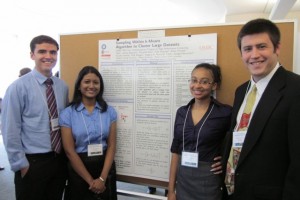
Team 2, from left to right: Jeremy Bejarano, Koushiki Bose, Anita Thomas, Tyler Brannan
Our team of undergraduates, Jeremy Bejarano, Koushiki Bose, Tyler Brannan, and Anita Thomas, researched methods to incorporate sampling within the standard k-means algorithm to cluster large data. The research took place during the summer of 2011 at the University of Maryland, Baltimore County, as a part of their REU Site: Interdisciplinary Program in High Performance Computing. We were mentored by Dr. Kofi Adragni and also received help from Dr. Nagaraj Neerchal and Dr. Matthias Gobbert. The research was proposed by Dr. George Ostrouchov from Oak Ridge National Laboratory, and we also received guidance from him during the process.
Abstract:
Due to advances in data collection technology, our ability to gather data has far surpassed our ability to analyze it. For instance, NASA’s Earth Science Data and Information System Project collects three Terabytes (1 Terabyte = 1024 Gigabytes) of data per day, from seven satellites called the Afternoon Constellation. Datasets such as these are difficult to move or analyze. Analysts often use clustering algorithms to group data points with similar attributes. Our research focused on improving Lloyd’s k-means clustering algorithm which is ill-equipped to handle extremely large datasets on even the most powerful machines. It must calculate N*k distances where N is the total number of points assigned to k clusters; these distance calculations are often time-intensive, since the data can be multi-dimensional. Dr. Ostrouchov suggested that sampling could ease this burden. The key challenge was to find a sample that was large enough to yield accurate results but small enough to outperform the standard k-means’ runtime. We developed a k-means sampler and performed a simulation study to compare it to the standard k-means. We analyzed the tradeoff between speed and accuracy of our method against the standard, concluding that our algorithm was able to match accuracy with significantly decreased runtime.
Algorithm:
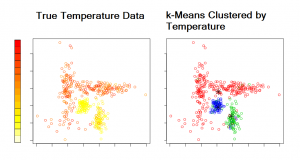
The standard k-means algorithm is an iterative method that alternates between two steps: classification and calculation of cluster centers. It begins with either user-specified centers or random centers. First, each data point is assigned to the cluster whose center is closest to it. Second, the mean (center) of each cluster is calculated. The algorithm iterates until convergence. Convergence occurs when no points are reassigned to a different cluster. Below is an illustration of k-means clustering. For display purposes, we plotted points as longitude by latitude. However, one could display the points by its attributes, e.g., relative humidity by pressure. The left plot gives the points colored by a temperature scale. Note, the color bar only applies to the left plot. The right plot shows the points in three groups (represented by red, green, and blue) clustered by temperature.
We improve the algorithm’s speed by introducing a sampling function within each of its iterations. The sample size required to achieve a confidence interval with a specified width for each cluster’s center is calculated and used for the next iteration. Once the algorithm converges on the sample, all N points are classified, and k centers are obtained using those final classifications.
We ran four sets of simulations with datasets of one, two, three, and four dimensions to compare the accuracy of the standard and sampler k-means. Accuracy is measured by the percentage of points correctly classfied. The table below lists results for a desired confidence interval of 95% with a width of 0.01 using over 119 million datapoints. For each dimension we present the best accuracy for 20 trials, along with the average and standard error (St. Err.) of the accuracies. Notice that within a single simulation, both algorithms have similar values for all three statistics reported.
| One Dimension | Two Dimensions | Three Dimensions | Four Dimensions | |||||||||
|---|---|---|---|---|---|---|---|---|---|---|---|---|
| Best | Average | St. Err. | Best | Average | St. Err. | Best | Average | St. Err. | Best | Average | St. Err. | |
| Standard | 99.0679 | 99.0679 | 0.0000 | 98.7610 | 98.7610 | 0.0000 | 99.8563 | 76.1653 | 5.7822 | 99.9719 | 69.9848 | 6.9862 |
| Sampler | 99.0679 | 99.0675 | 0.0001 | 98.7610 | 98.7611 | 0.0000 | 99.8562 | 77.4223 | 5.4655 | 99.9719 | 69.9910 | 6.9855 |
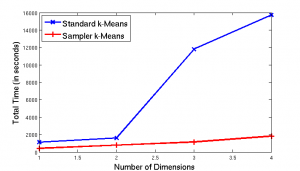
The plot illustrates the total runtime of all twenty trials in seconds versus number of dimensions for both the standard (blue line) and sampler (red line) algorithms. Note, the blue line shows a significant inrease in time for the standard algorithm on three and four dimensions. However, the red line shows the sampler’s steady (almost linear) growth across dimensions. This difference between the two lines illustrates that as our datasets enter three and four dimensions, the sampler is approxmiately ten times faster than the standard, rather than twice as fast in one and two dimensions.
Our sampler algorithm used approximately 0.5% of the datapoints. Hence, it achieves substantial speedup without losing accuracy compared to the standard k-means algorithm. The best accuracies are virtually the same for both algorithms; the averages and standard errors are also comparable. Thus, the sampler meets the criterion of matching the standard k-means in accuracy. Furthermore, our sampler algorithm always has a smaller runtime than the standard, and the difference grows significantly for three and four dimensions. Thus, our algorithm also meets the criterion of significantly decreasing runtime. Therefore, analysts should use our sampler algorithm, expecting accurate results in considerably less time.
Links
Jeremy Bejarano, Koushiki Bose, Tyler Brannan, Anita Thomas, Kofi Adragni, Nagaraj K. Neerchal, and George Ostrouchov. Sampling within k-Means Algorithm to Cluster Large Datasets. Technical Report HPCF-2011-12, UMBC High Performance Computing Facility, University of Maryland, Baltimore County, 2011. Reprint in HPCF publications list
Poster presented at the Summer Undergraduate Research Fest (SURF)
Participant Anita Thomas Presents in Undergraduate Mathematics Symposium
Click here to view Team 1’s project
Click here to view Team 3’s project
Click here to view Team 4’s project

